Bitcoin’s price has surged over the last couple of days and has broken past a key resistance level. While the momentum is highly bullish, there are some caution signals to look out for.
By: Edris
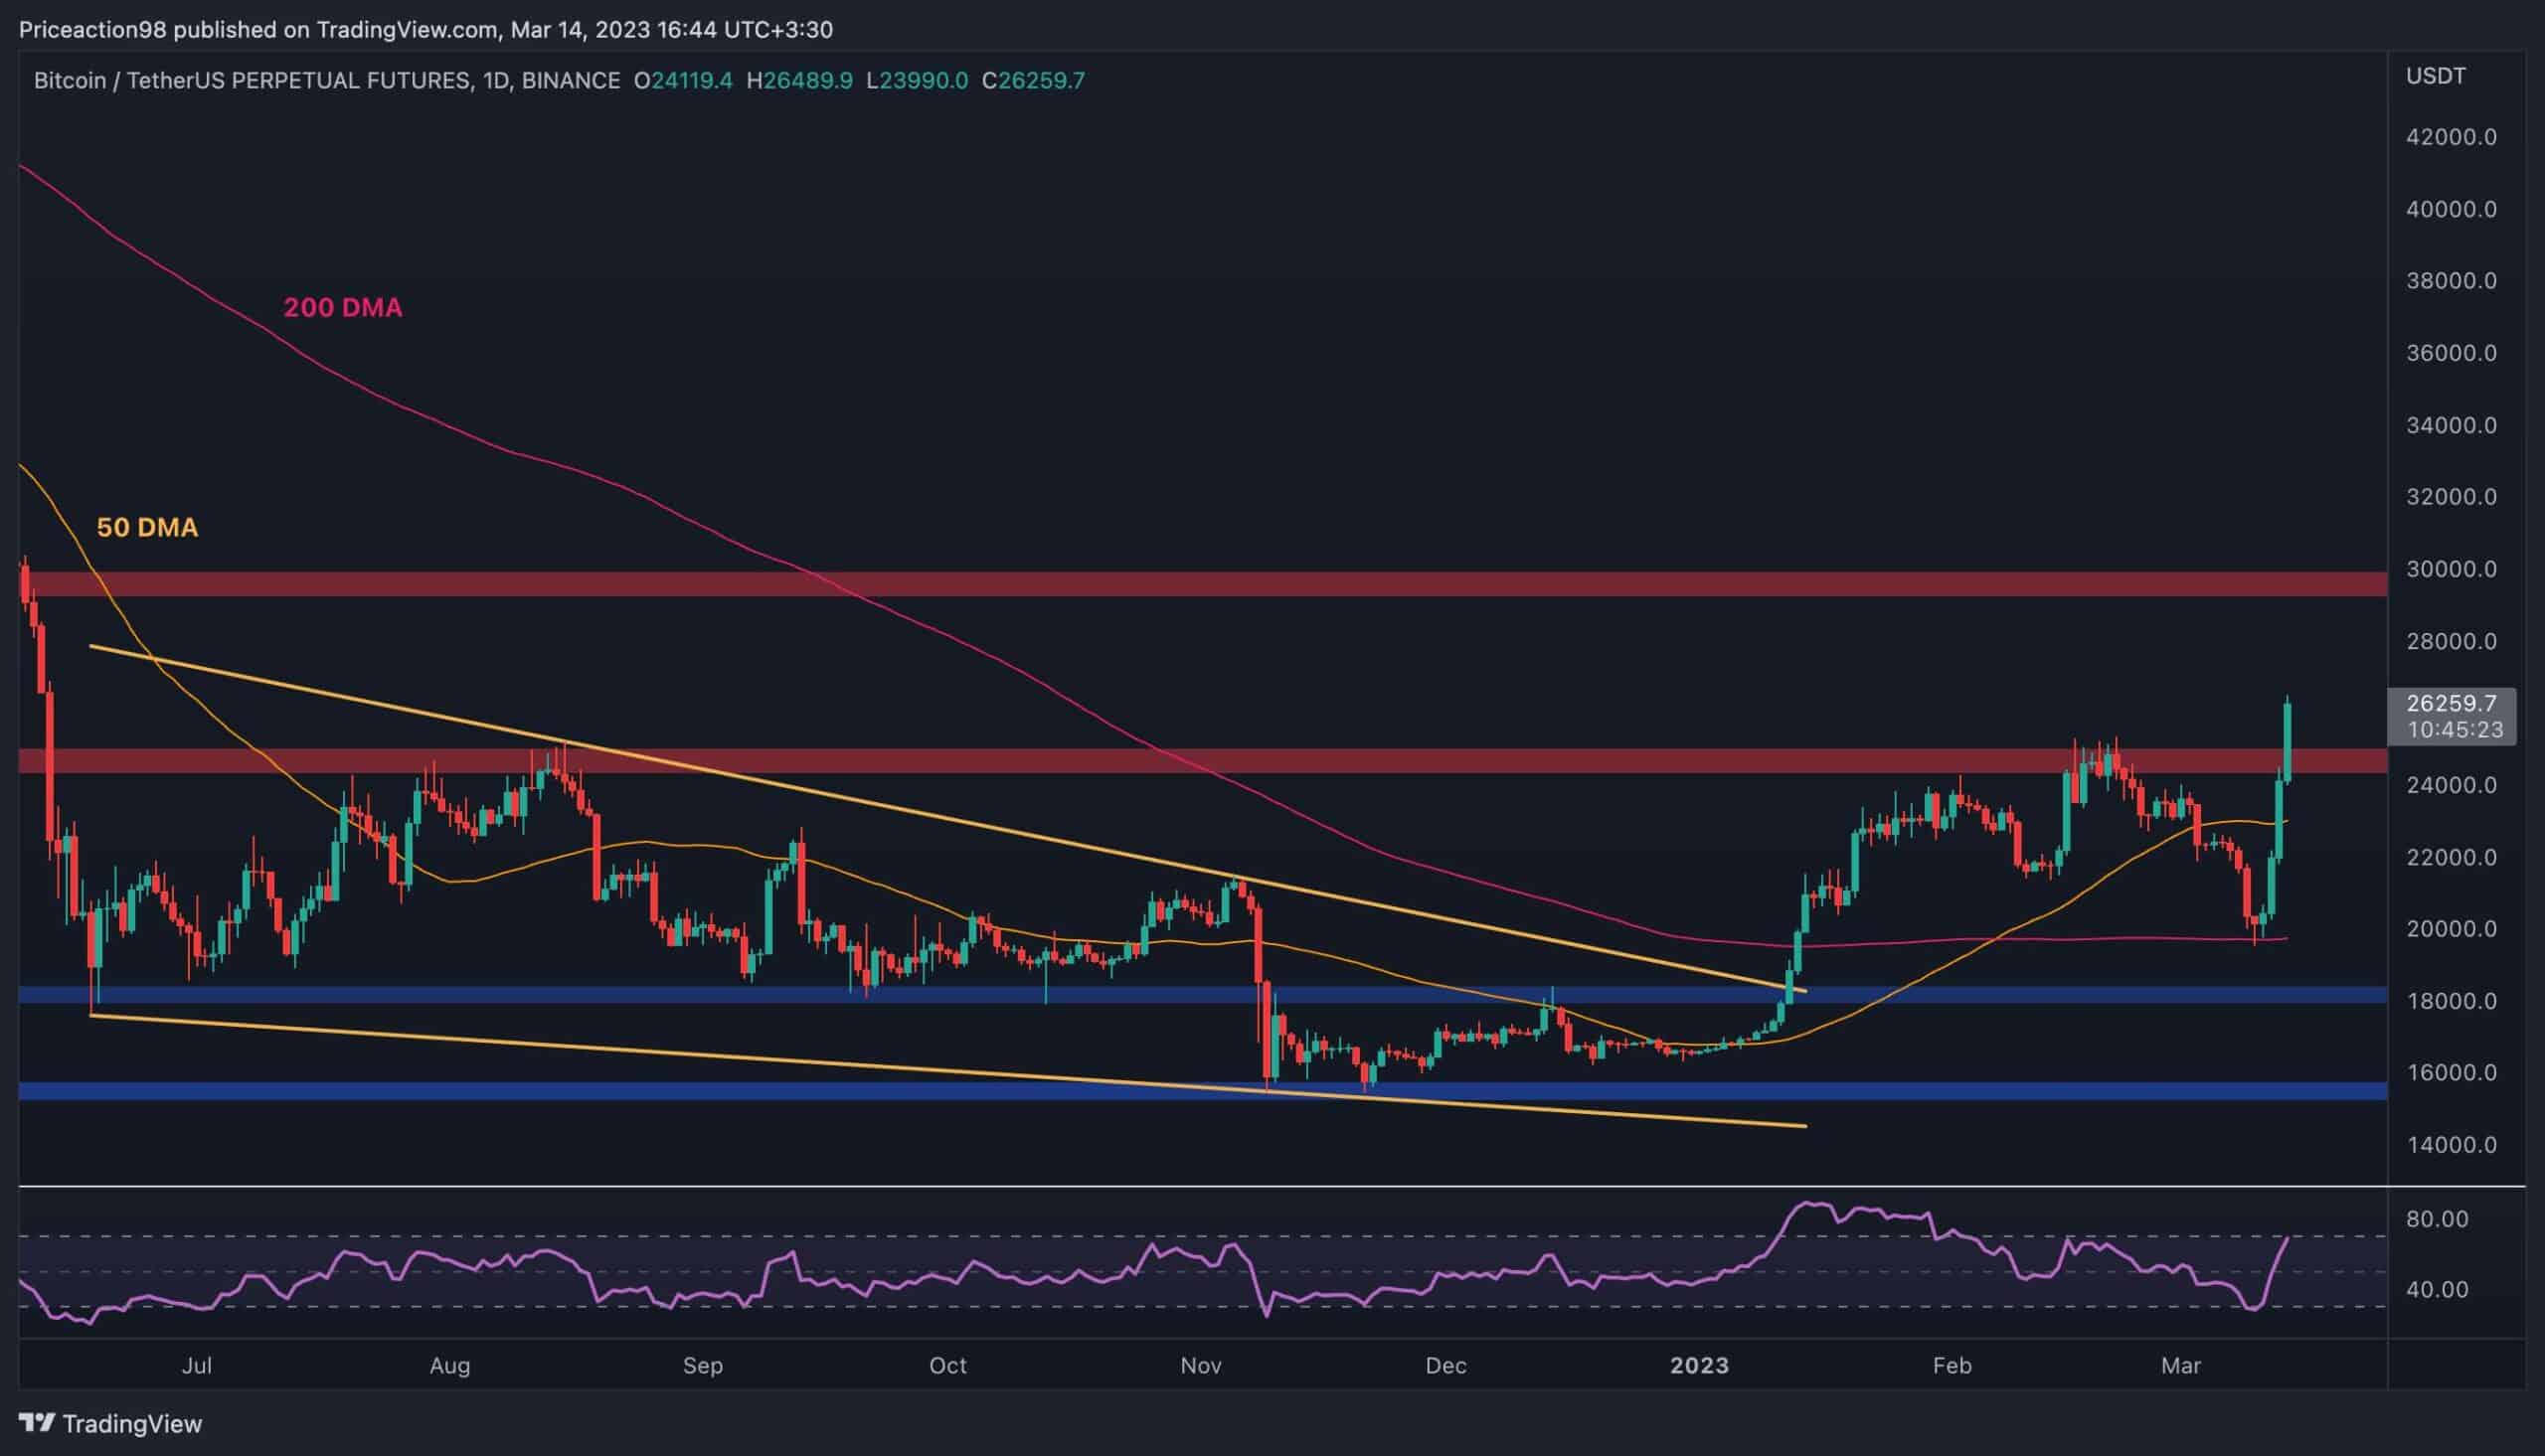
On the daily chart, the price has rebounded decisively from the significant 200-day moving average, located around the $20K mark a few days ago. Since then, the market has been trending impulsively to the upside, finally breaking above the $25K resistance level.
Currently, the key $30K zone is the next probable target for the price in the short term. A breakout above this area would be wonderful for the bulls, as the market would likely enter a bullish phase in the coming months.
However, the RSI indicator should be monitored closely as it is entering the overbought zone, and a bearish pullback or consolidation is probable in the short term.
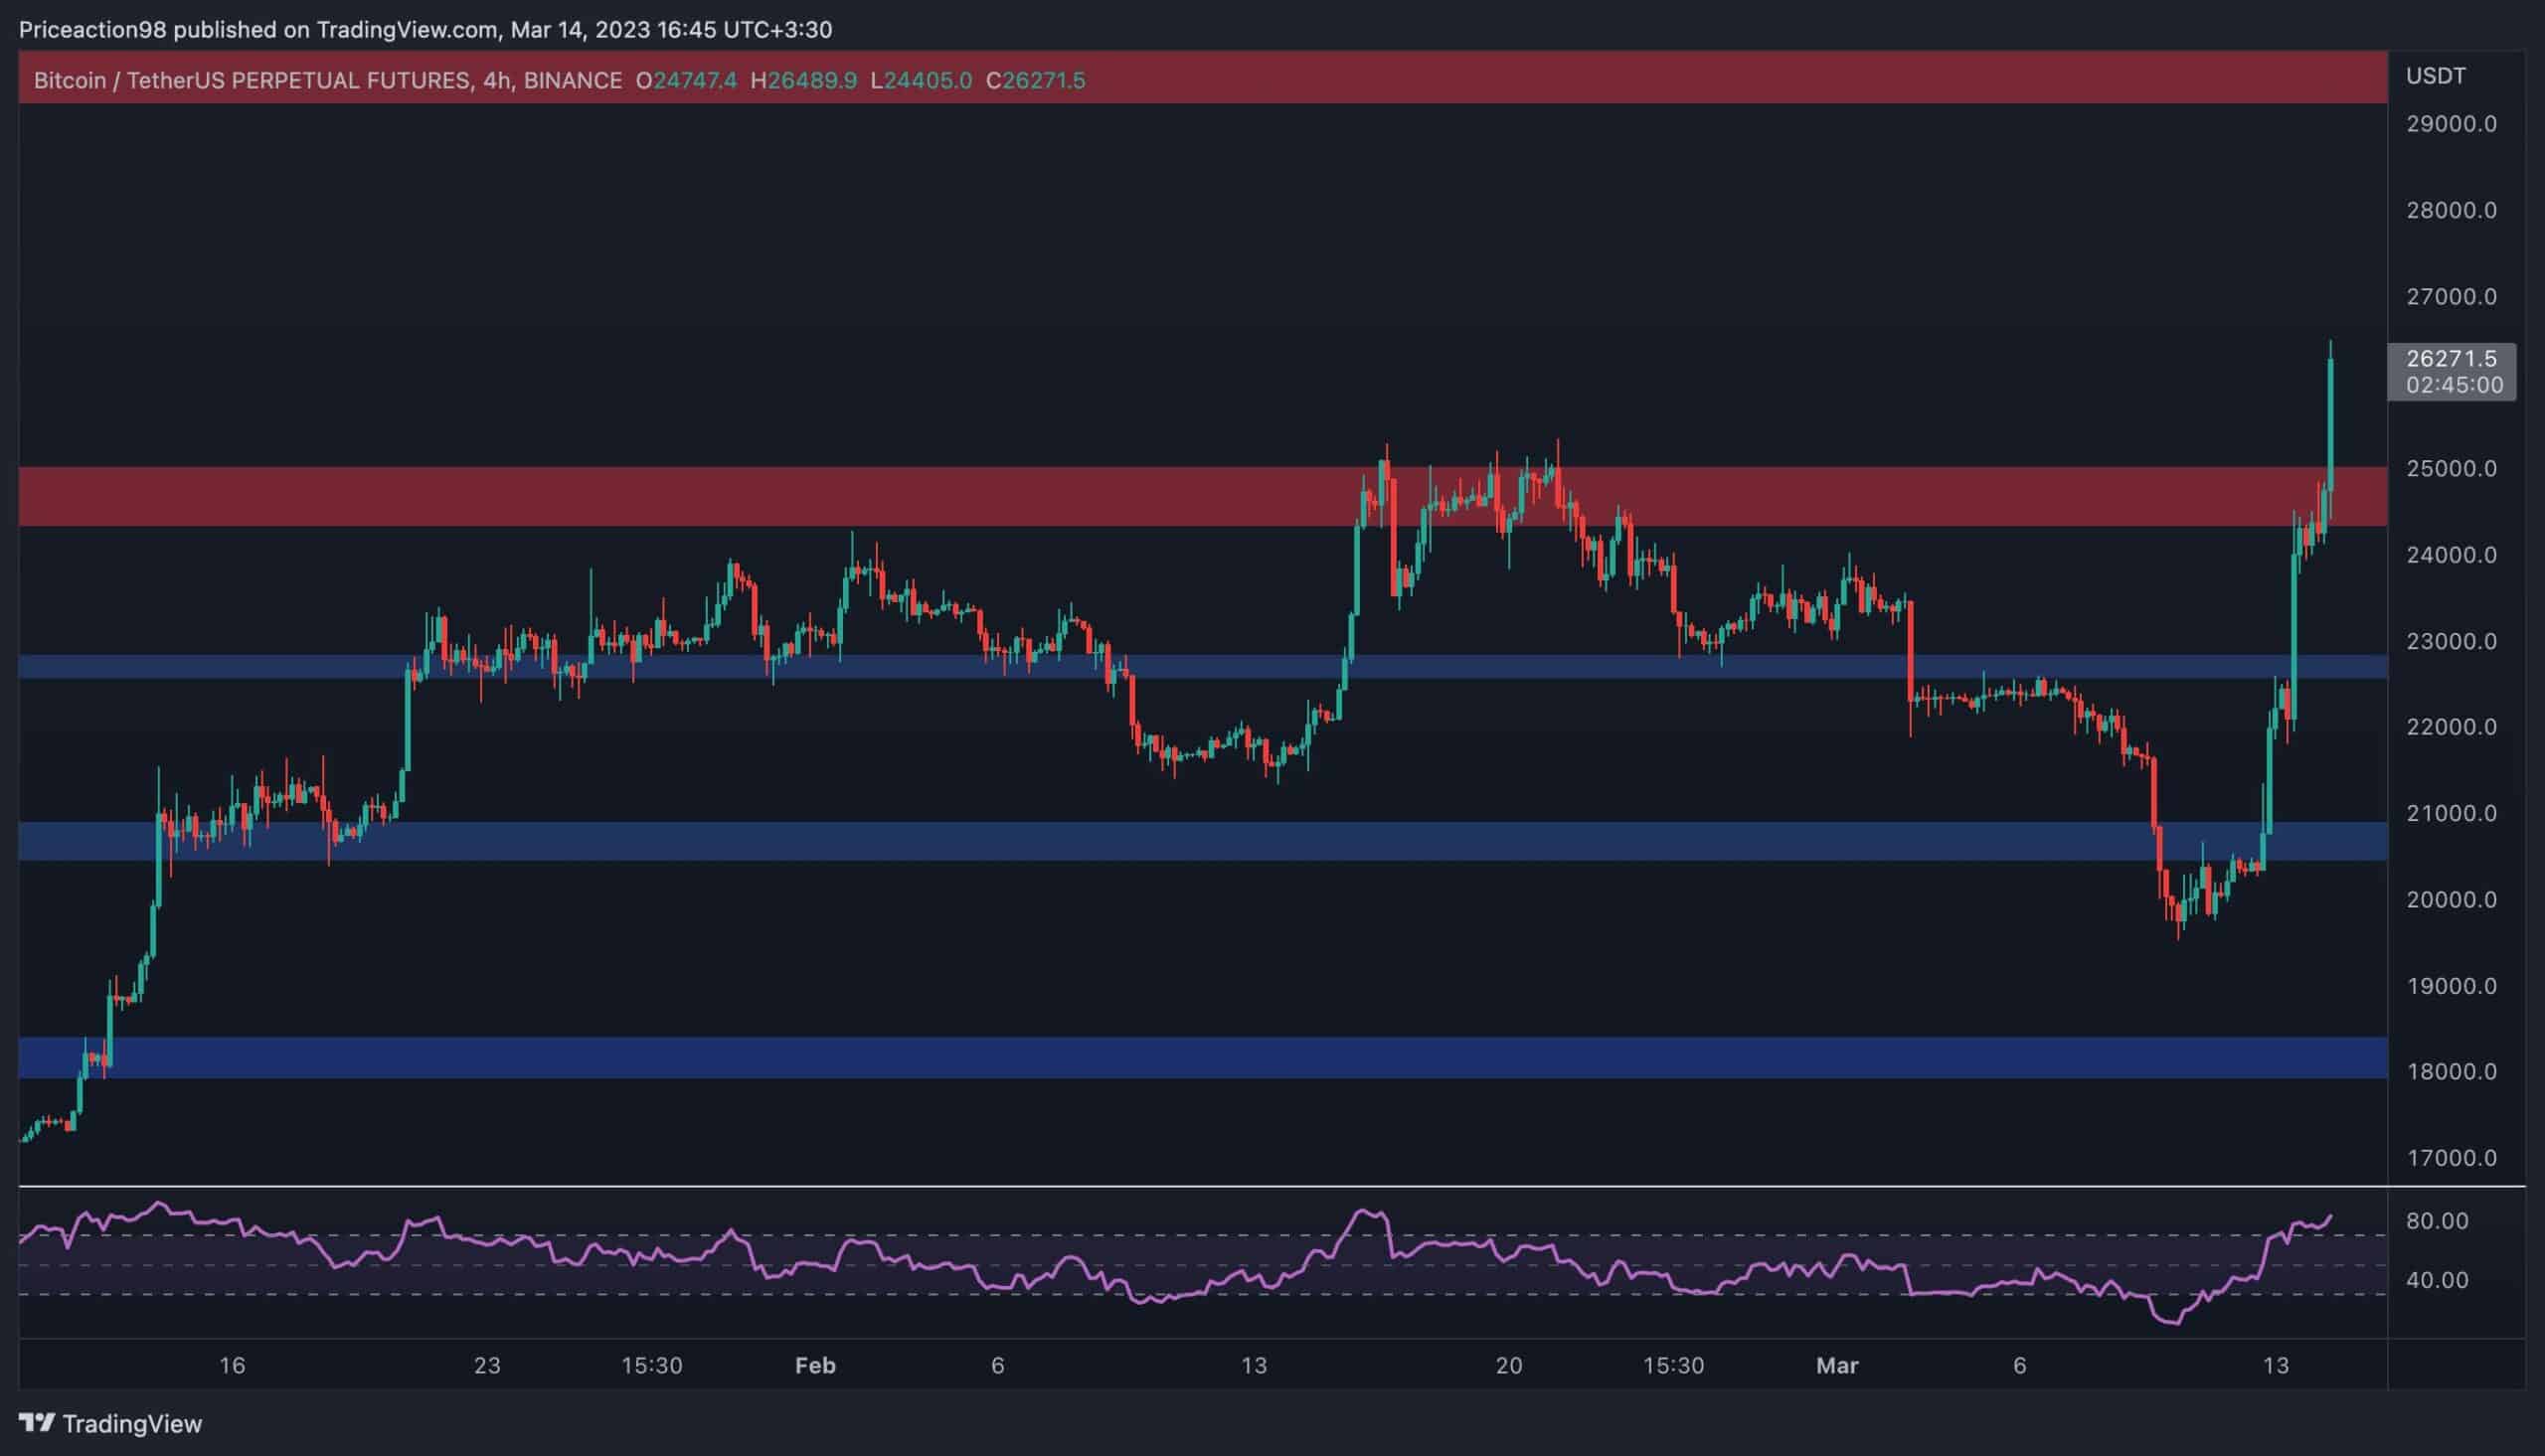
Looking at the 4-hour timeframe, the rally becomes more interesting. The price has recovered around the $20K area and has broken past two significant resistance levels in a short while. Both the $23K and $25K levels can now provide some support in case of a retracement.
The RSI indicator also demonstrates clear overbought signals in this timeframe, and a drop below the 70% level could trigger a pullback in the next coming days. Yet, with a clear bullish market structure and multiple significant support levels available, the bulls can be hopeful for the price to reach the key $30K resistance level even if a correction materializes.
By: Edris
Bitcoin’s price has finally broken above a key technical resistance level, leaving investors wondering whether the bear market is finally over or if the recent rally is just another bull trap. Therefore, analyzing the miners’ behavior could provide useful insight.
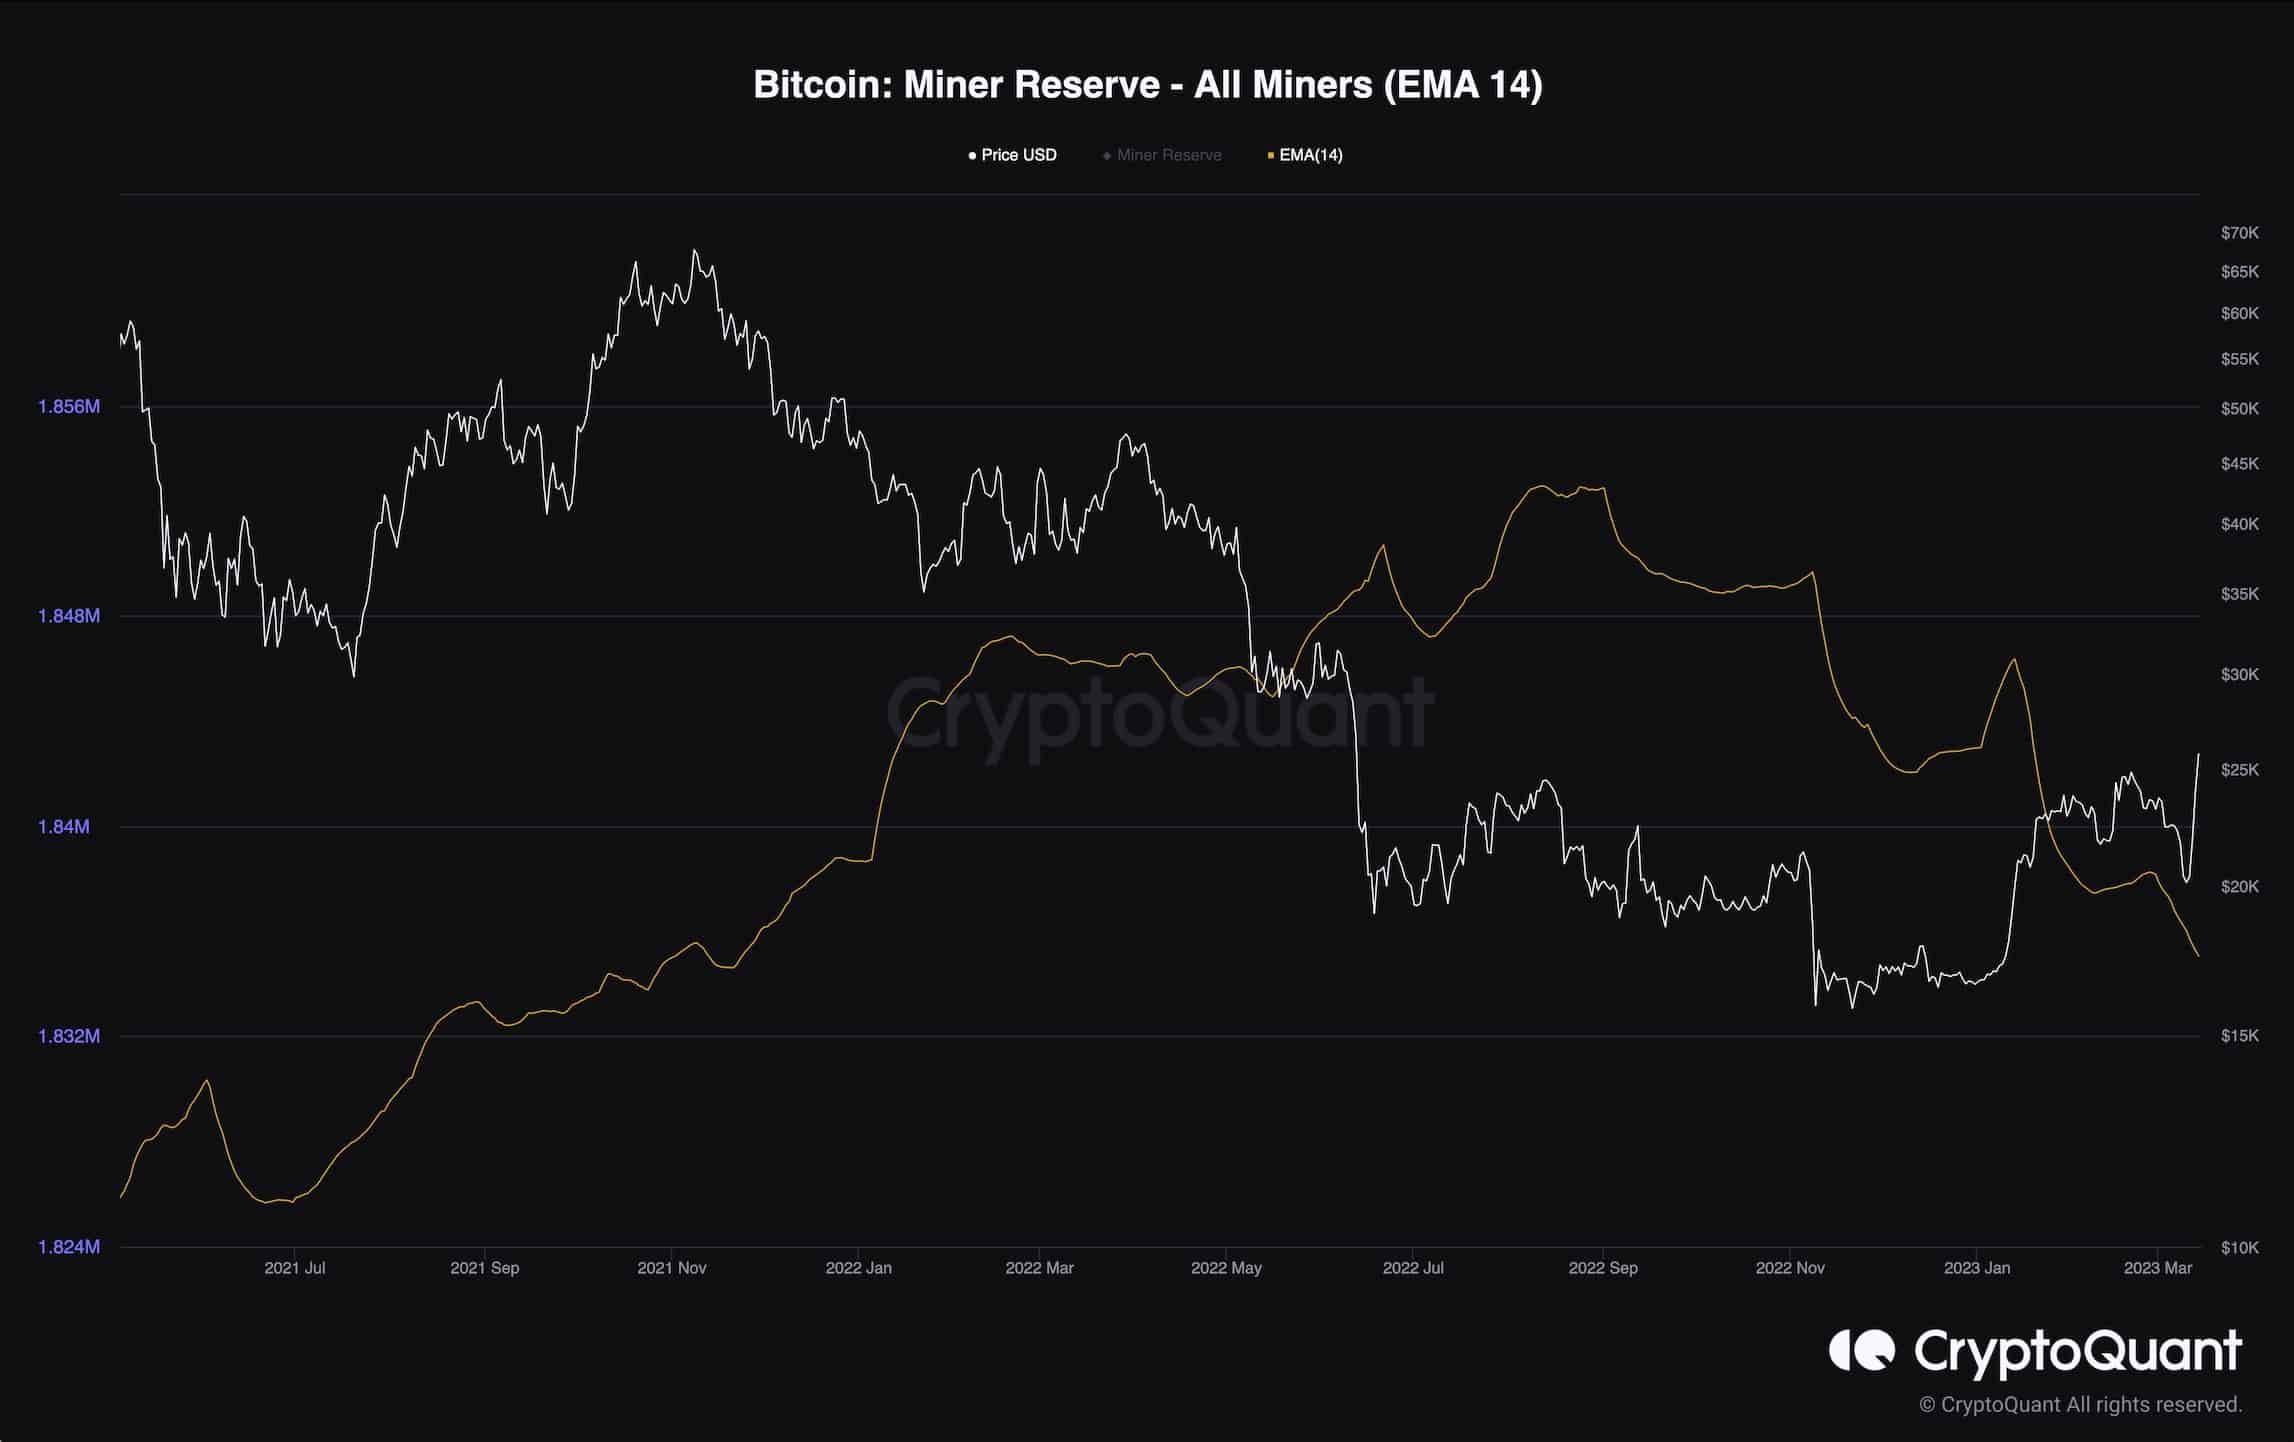
Looking at the miner reserve metric, which measures the amount of BTC in their wallets, it is evident that they have been using the recent surge in price as a selling opportunity to cover their operational costs.
This metric has been in a steep downtrend over the past month and shows no signs of slowing down. If the miners’ selling pressure continues, a bearish reversal could be expected in the short term as the market would be flooded with excess supply.