Last week, the BTC price impulsively broke down the 50-day moving average line at $40K to the downside and lost over $3K shortly after.
However, the bearish momentum started to fade as the move slowed down, and it seemed like a bottom was forming amid $37K. Earlier today, following the positive news on behalf of Joe Biden, the price broke back above the 50-day moving average once again, with a huge daily green candle.
By: Edris
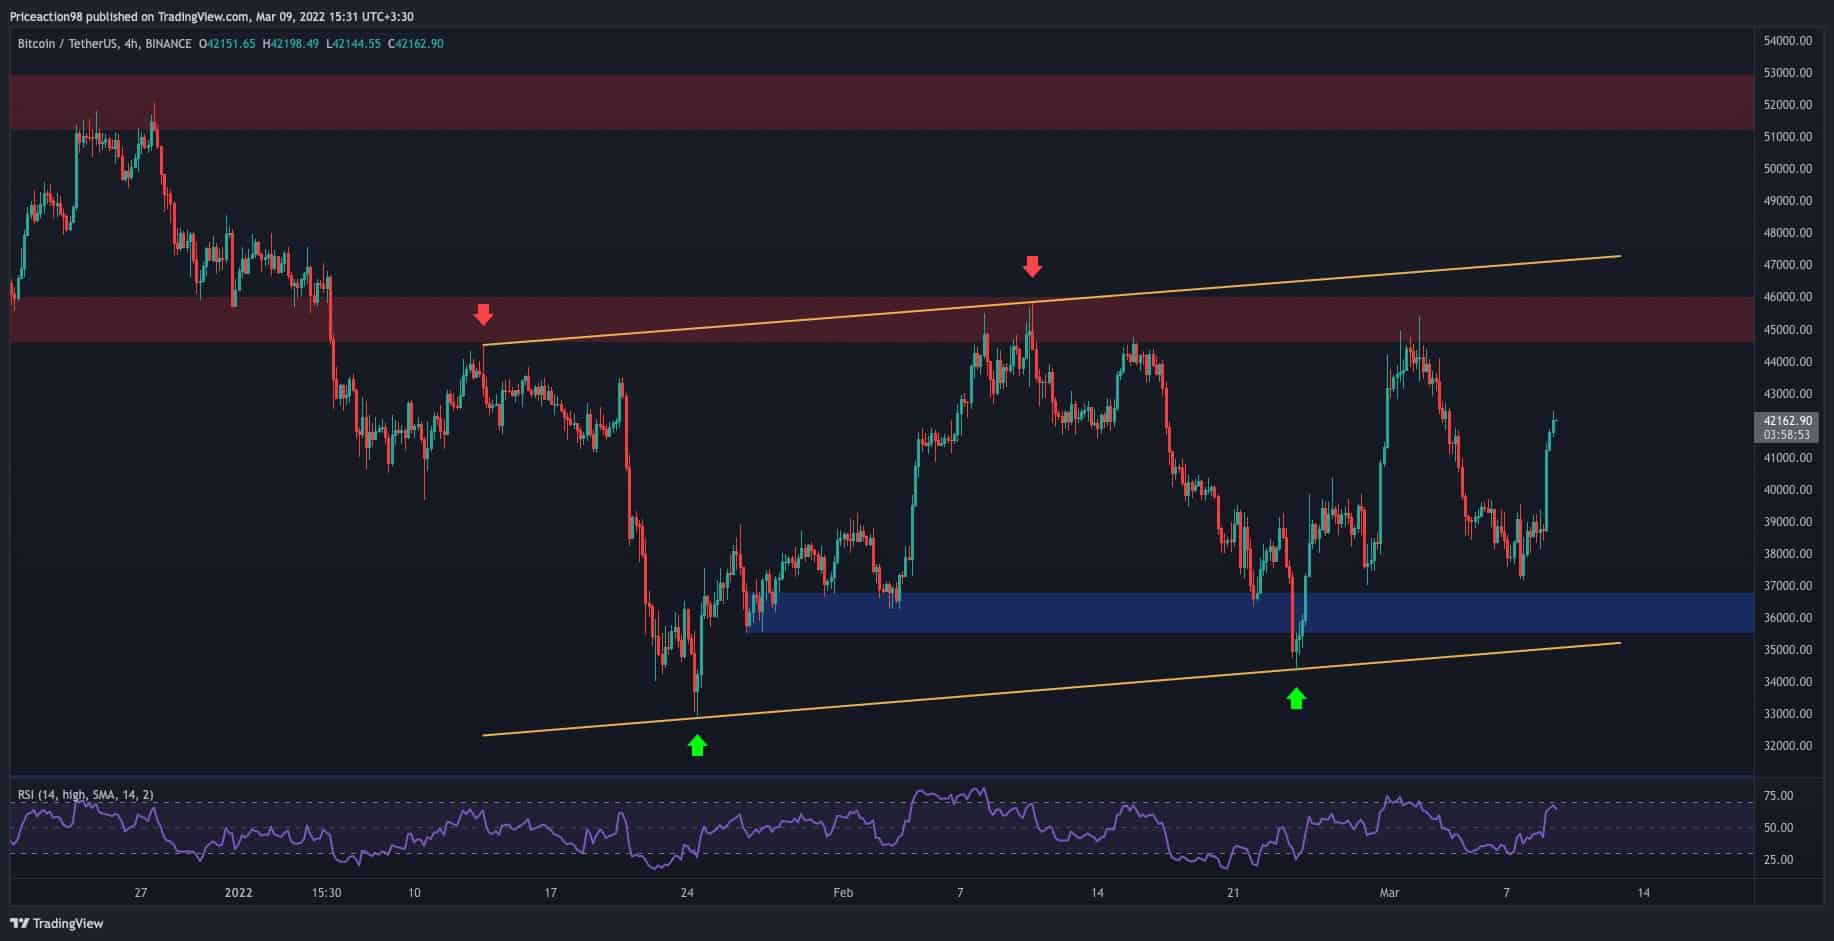
Bitcoin’s price has been able to find support at the $36-37K range once again, as the consolidation between $36K and $45K levels continue.
Considering the current bullish momentum, it seems like a retest of the 100-day moving average (at $43.7K), and eventually, the $45K resistance zone, is imminent.
The latter has proved to be a strong supply zone, and it has rejected the price on multiple occasions over the past weeks. If this level is finally broken, the next target is likely the 200-day moving average (~$49K), one of the most significant indicators to determine whether the market is under bullish or bearish conditions.
Taking a closer look at the price action on the 4-hour timeframe, it is evident that the price is still ranging inside a large bearish flag pattern and is currently on its way to testing the upper boundary of the pattern for the third time.
The flag’s ceiling is currently around the $48K mark, and in case Bitcoin fails to break above the pattern, a drop for another retest of the $36K level could be next.
On the other hand, a bullish breakout would invalidate the bearish pattern, and a rally towards the $52K zone becomes possible. Meanwhile, the RSI indicates that bulls are in control of the market now, and it is almost reaching the “overbought” level of above 70% on the 4-hour timeframe. However, this bullish trend is likely to go on for at least a few more days as the price is yet to reach a significant obstacle.
By: Shayan