Source: TradingView
Technical Analysis
By: Edris
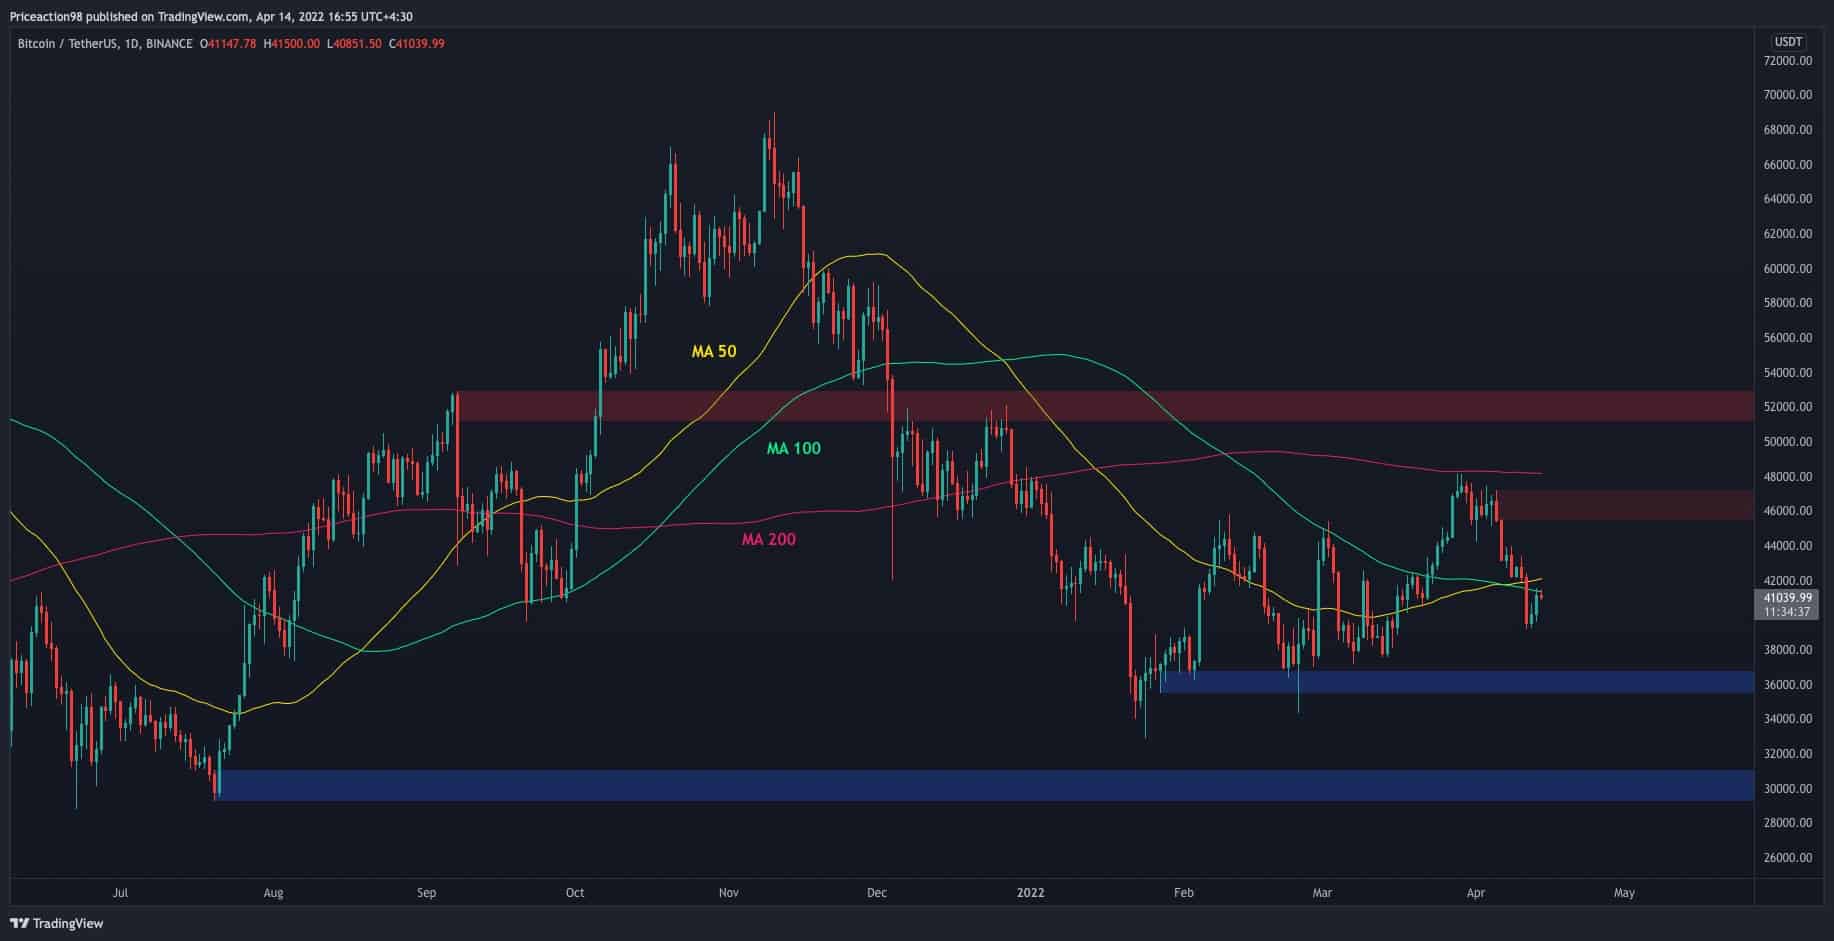
Daily timeframe:
Bitcoin has been dropping impulsively in the past couple of weeks after being rejected from the 200-day moving average. This level has historically acted as a strong resistance during previous bear markets, and the price failing to break back above it may be considered a bad sign.
The price has also broken below the 50-day and 100-day moving averages and is currently retesting them from below. These levels printed a bullish crossover last week, but the overwhelming bearish momentum has led to both being broken to the downside.
If the price fails to break back above them, a retest of the $36K area in the short term would be more probable. On the other hand, if the price could break back above, the $47K supply zone and the 200-day moving average remain significant resistance levels.
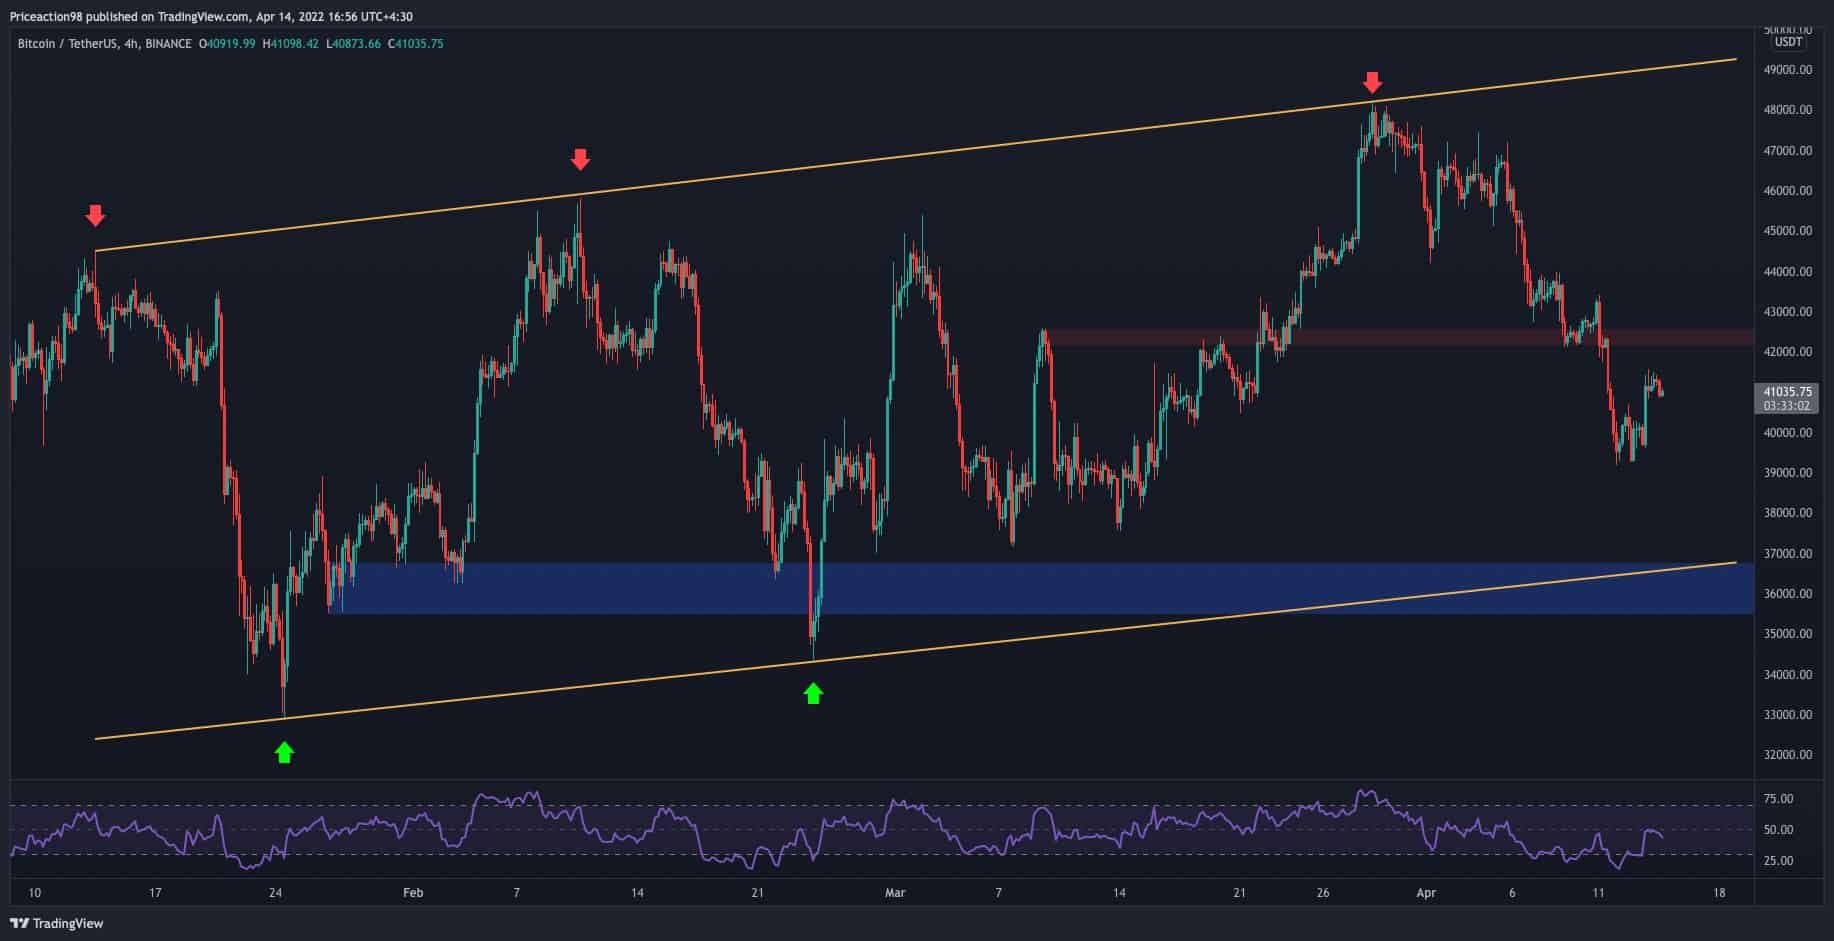
4-hour timeframe:
On the 4-hour time frame, it is evident that the price failed to hold above the short-term support level ($42K) and is currently making a pullback and could potentially continue going down. The large bearish flag pattern has worked well so far as a bearish reversal occurred when the price tested the top trendline for the third time.
The RSI indicator is also showing values below 50 which indicates that the bears are in full control at the moment. The $36K area and the lower boundary of the bearish flag remain as key support levels, and if the price breaks below them, a continuation and a lower low than the recent $33K bottom would be more probable. Furthermore, the $42K zone has currently transformed into resistance after being broken, and the price should trade above this level before any bullish move could be anticipated in the short-term.
By Shayan:
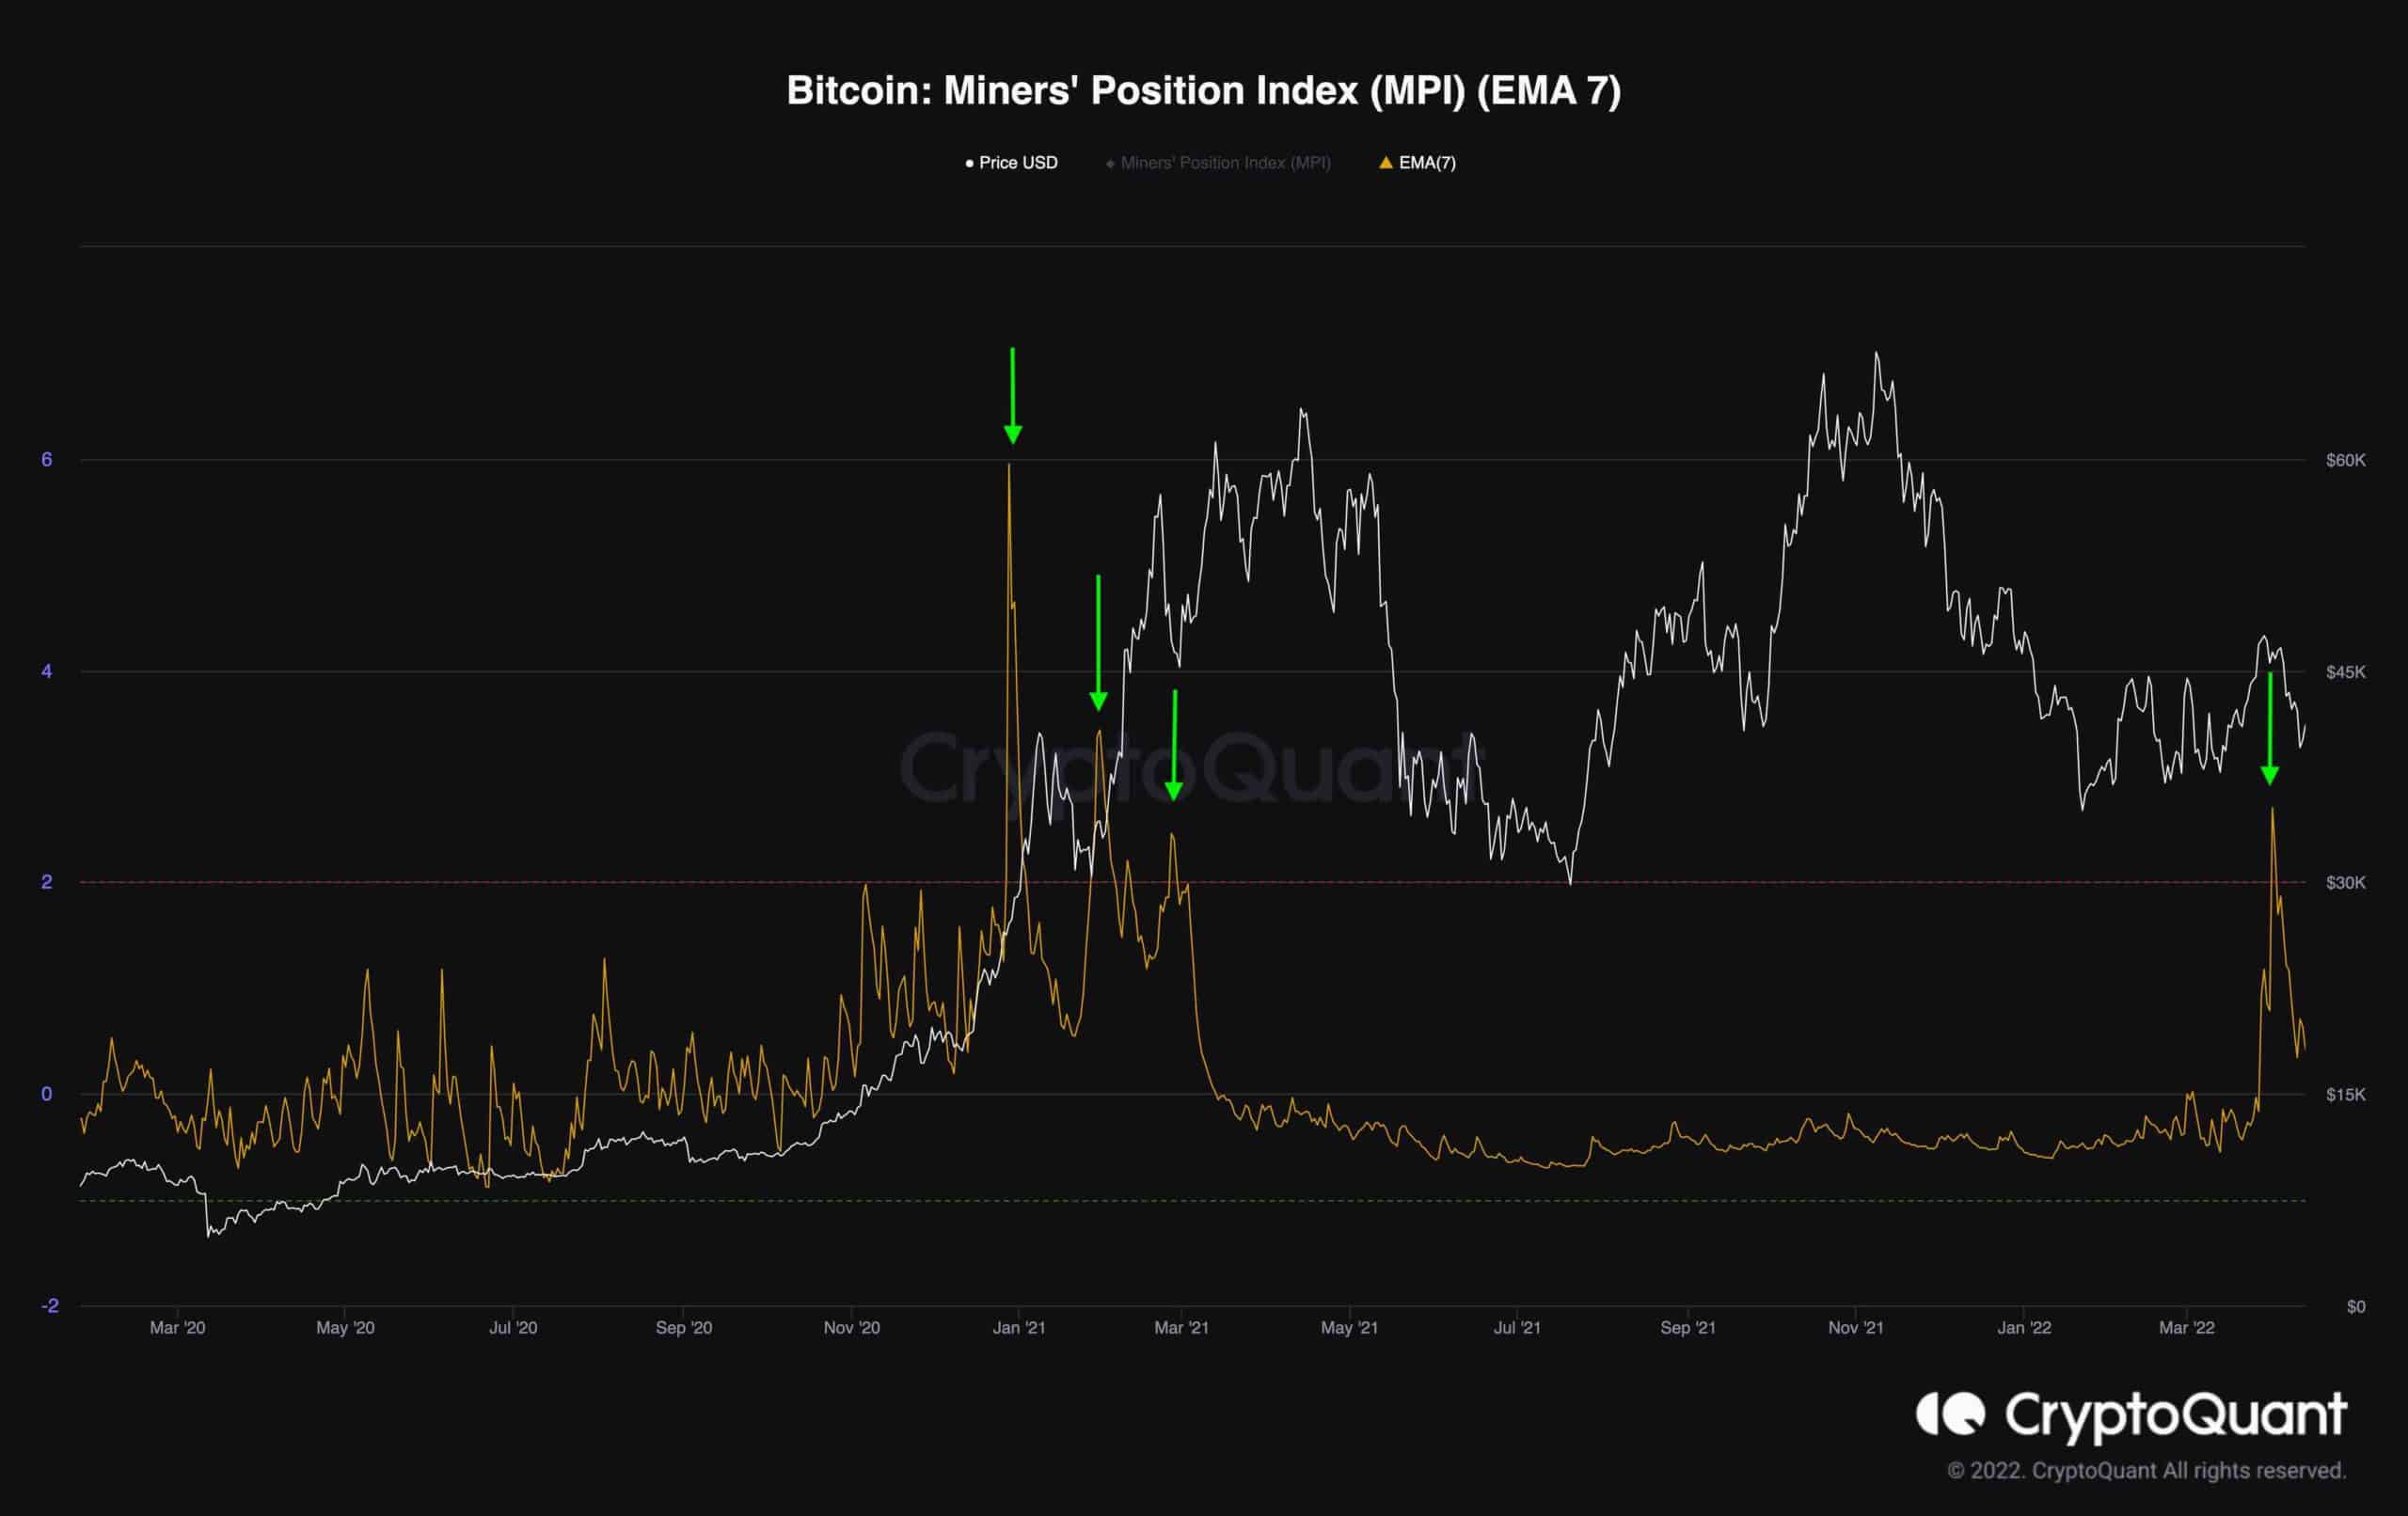
One of the most important indicators for evaluating Bitcoin miners’ activity and the sentiment is the Miner’s Position Index (MPI). Following a price increase to $48K, the MPI measure has shown a big spike in the last several days, indicating that miners are selling a portion of their holdings and taking profits.
This type of behavior was also seen three times during the bull market in early 2021. Miners’ selling pressure tends to bring bull markets to a close or exacerbate bearish movements. This is a bearish signal, indicating that the miners believe these prices are suitable for profit-taking.