BTC/USD chart via Tradingview.
Bitcoin’s price remains stuck under the key 0.618 Fibonacci level at $13,360 going into this week after little bullish momentum arrived during the opening of the US traditional markets. Wall Street, meanwhile, is painted in red.
Over shorter timeframes, it’s clear that the general sentiment is still bullish as the leading asset continues to print higher lows. However, trading volumes are beginning to decline, and there’s a growing divergence between the RSI and price action, which suggests things may turn bearish soon.
Since the Paypal news broke on October 21, over $33 billion has flooded back into the crypto space and helped the leading asset’s market dominance break back over 61% for the first time since August 2, 2020.
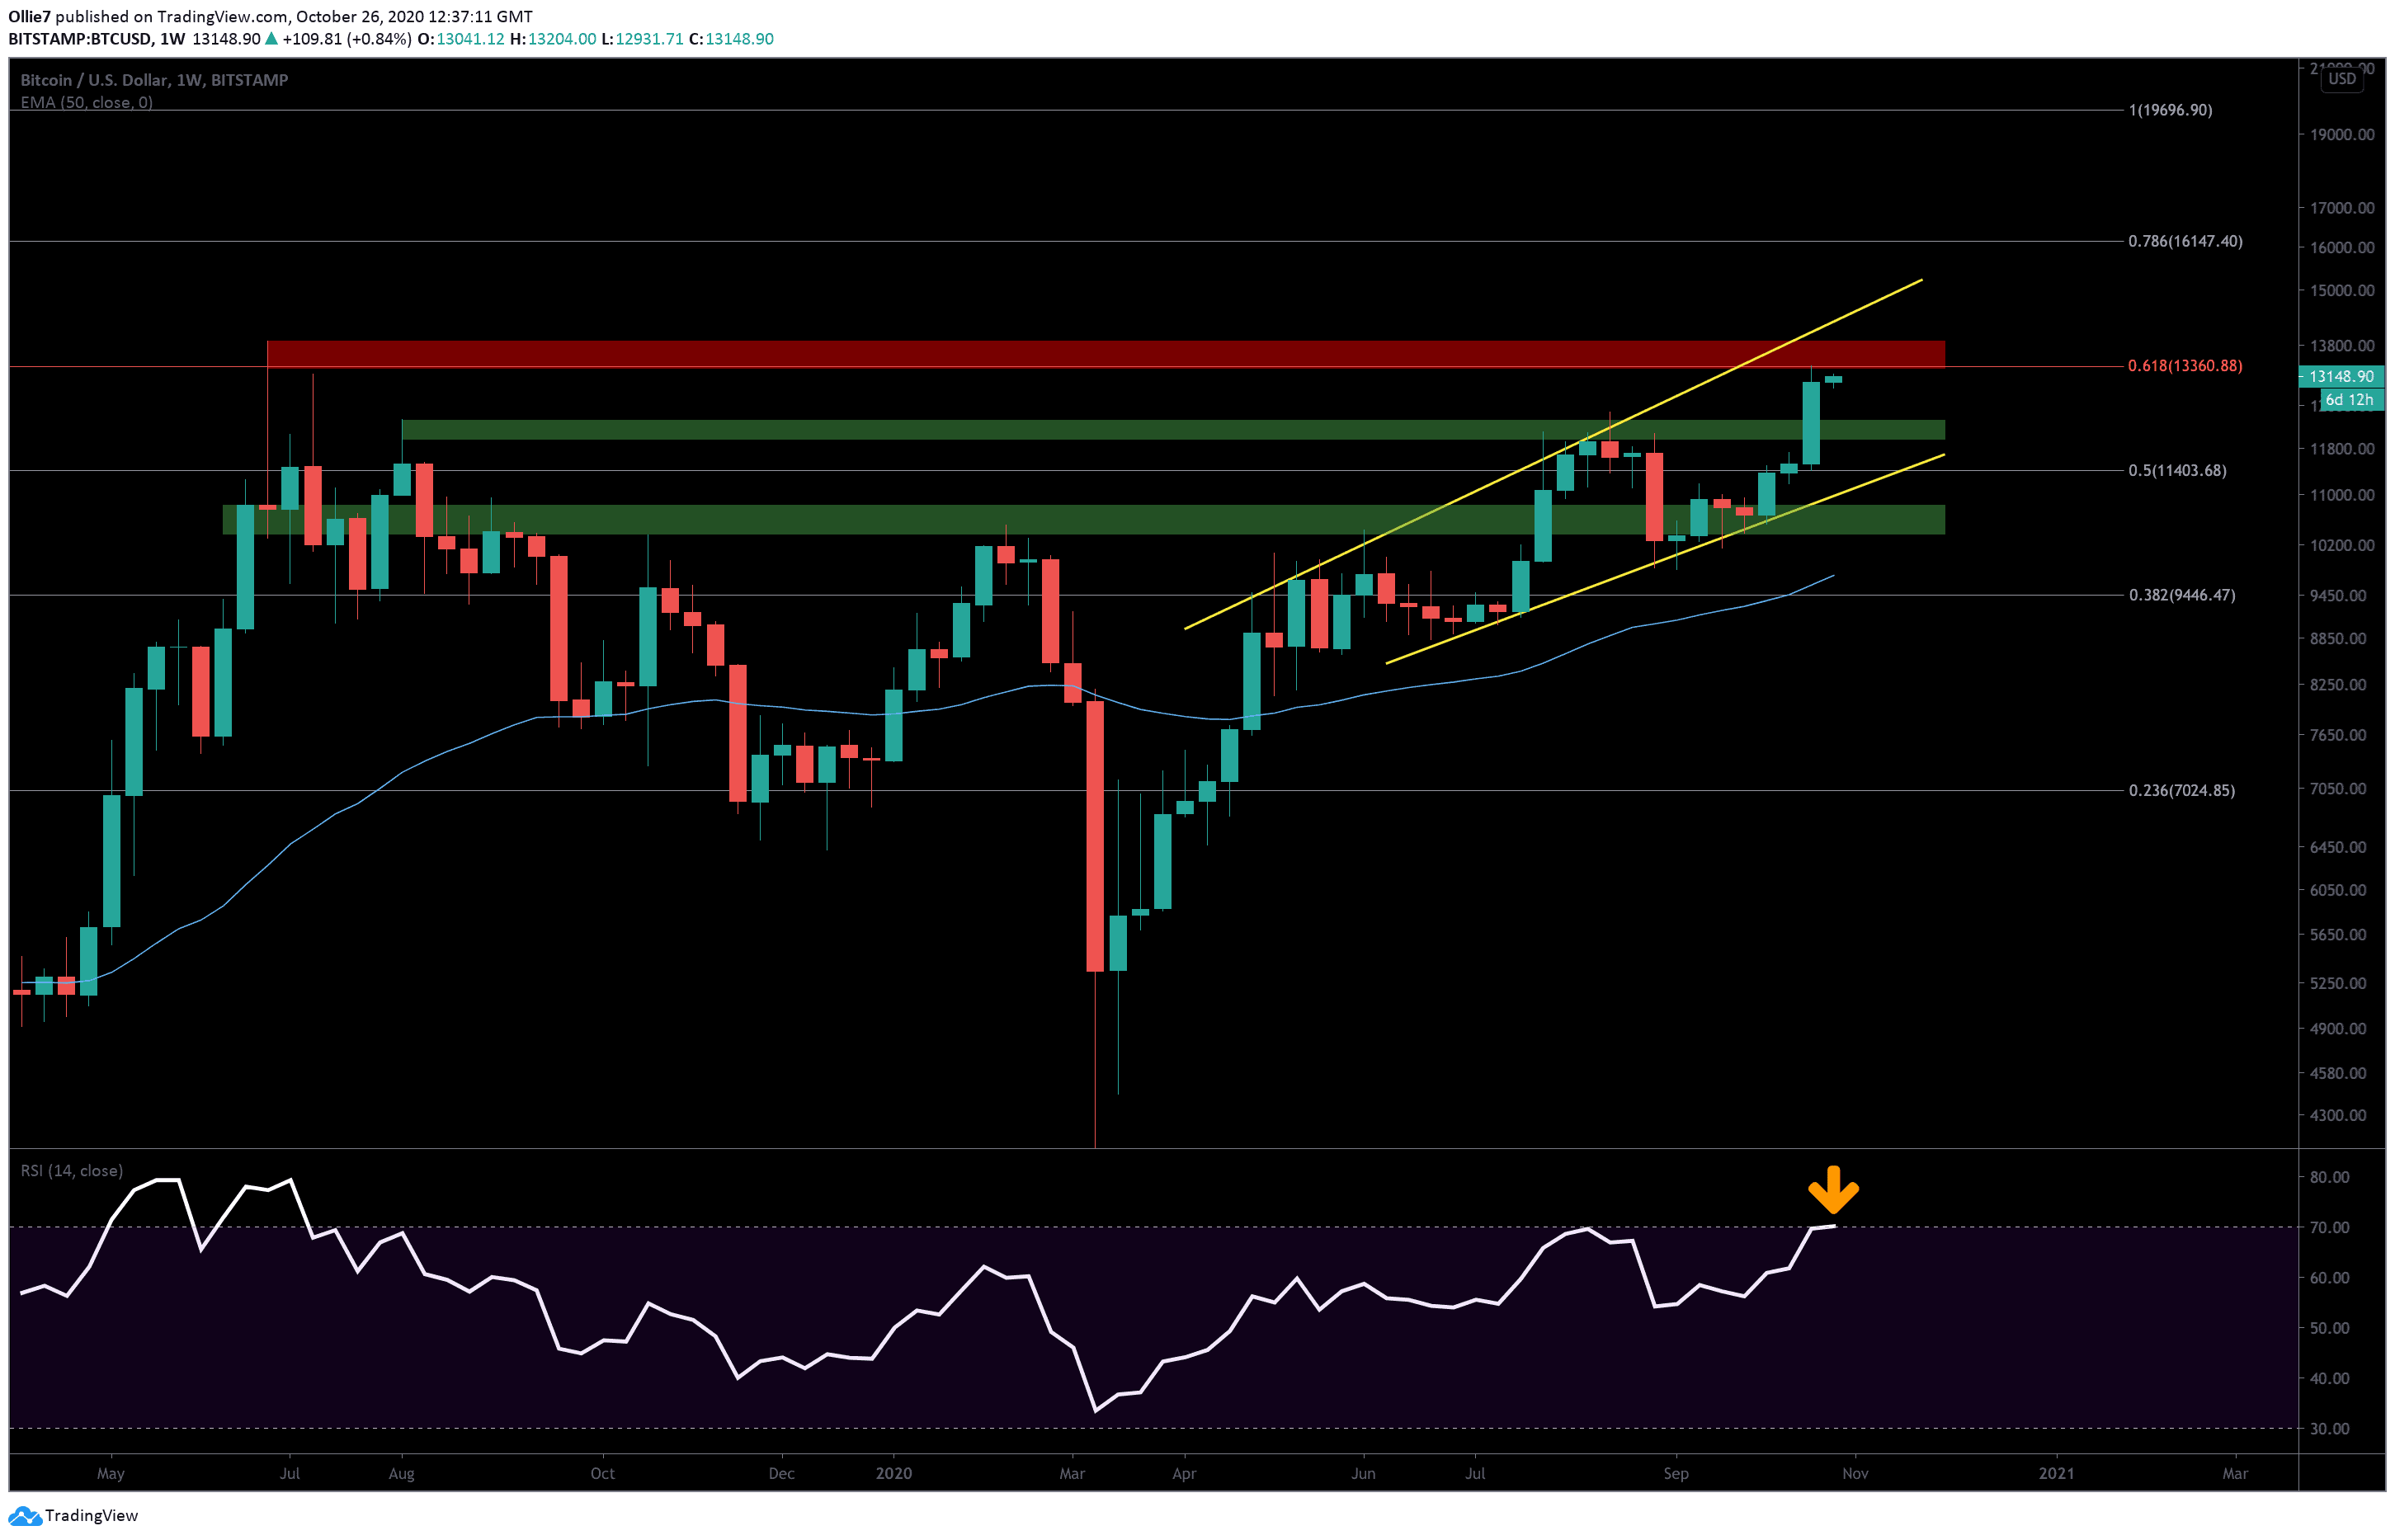
On the weekly BTC/USD chart, we can see that the main resistance area (red shaded zone) standing in the way of Bitcoin right now is the aforementioned Fibonacci level and the June 24, 2019 high at $13,950.
This top price point also overlaps with the upper resistance of the broadening wedge pattern (yellow lines) that BTC has been tracking inside of since April 27, which makes it a particularly strong level for bulls to overcome.
If momentum picks up again, however, and bulls manage to set a new 490+-day high, then the next likely areas of resistance will probably lie somewhere around the psychological $14K mark, the $14,400 level, and $14,600.
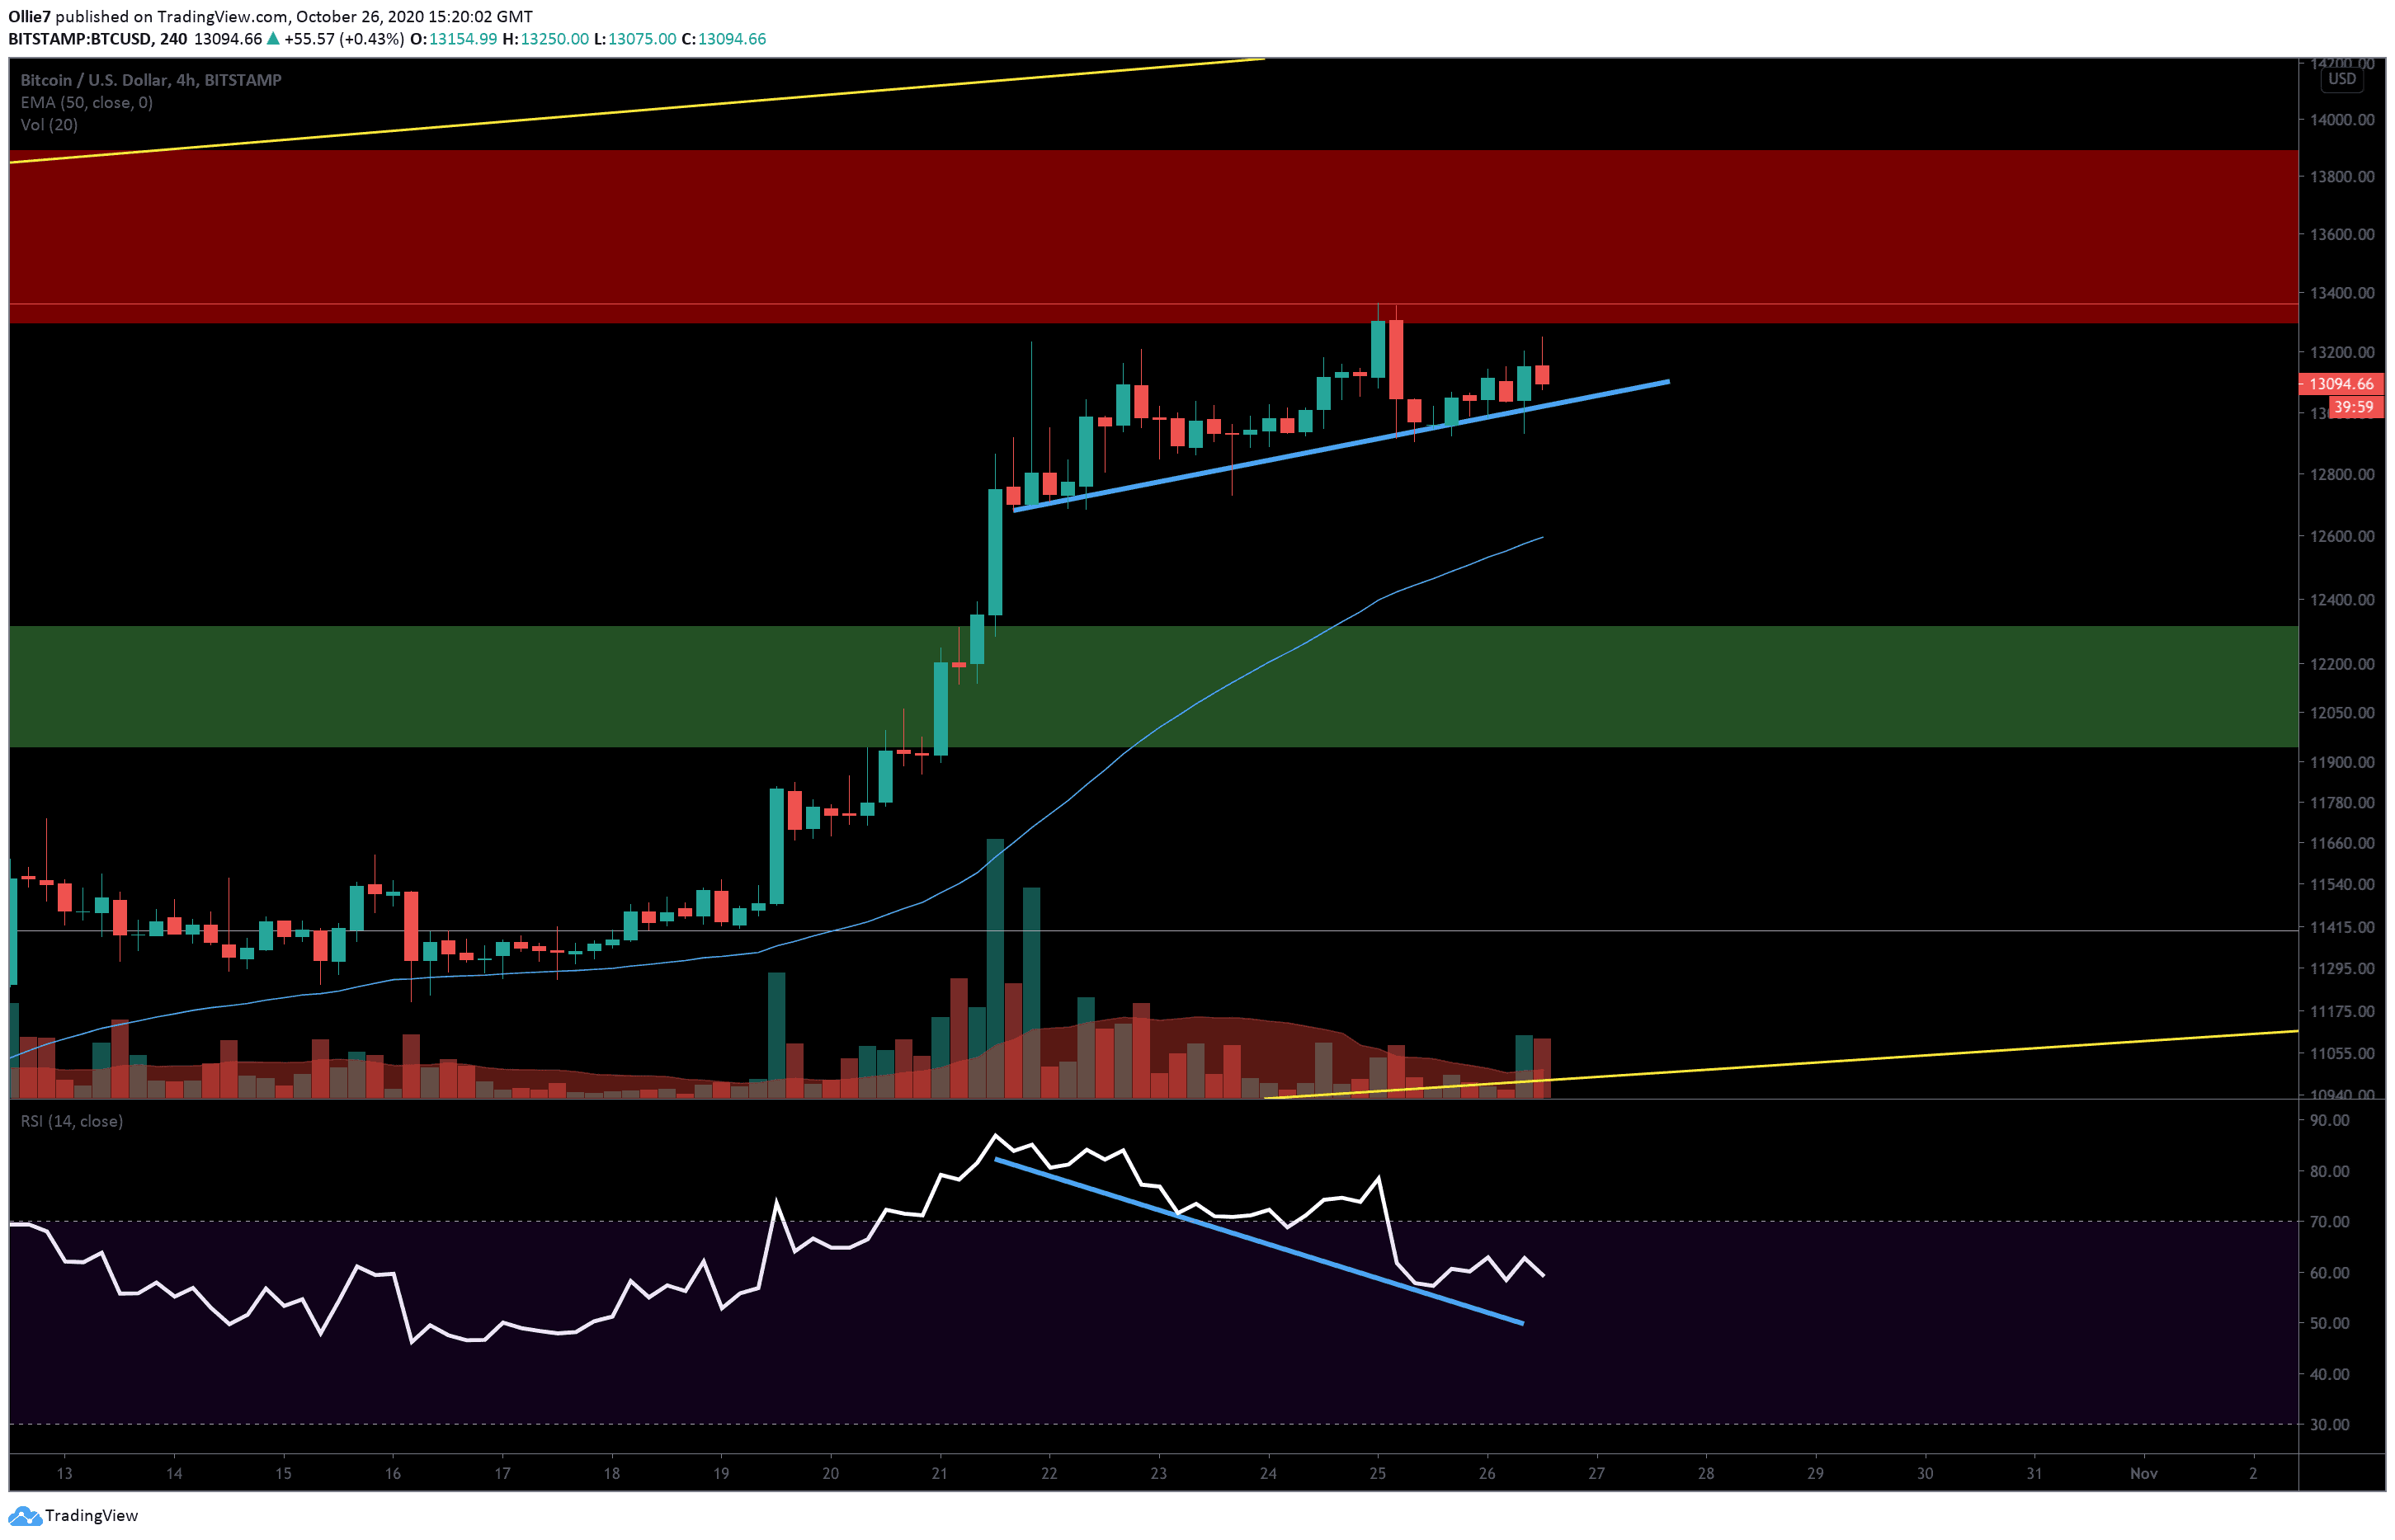
If the strong bearish divergence on the 4-hour timeframe plays out (light blue lines), we should expect the first area of support at the 50 EMA at $12,600, followed by the first major support zone (green shaded area) between $12,300 and $11,950. Under that, we also have the 0.5 Fibonacci level at $11,400 and the support line of the broadening wedge pattern approximately around $11K to catch any dips if prices decline further.
Total market capital: $401 billion
Bitcoin market capital: $243 billion
Bitcoin dominance: 60.5%
*Data by Coingecko.