Bitcoin’s price still fails to indicate any form of strength, even after crashing by more than 70%. The price is currently on a slow decline after a small rebounding from the $17.5K a couple of weeks ago.
By Edris
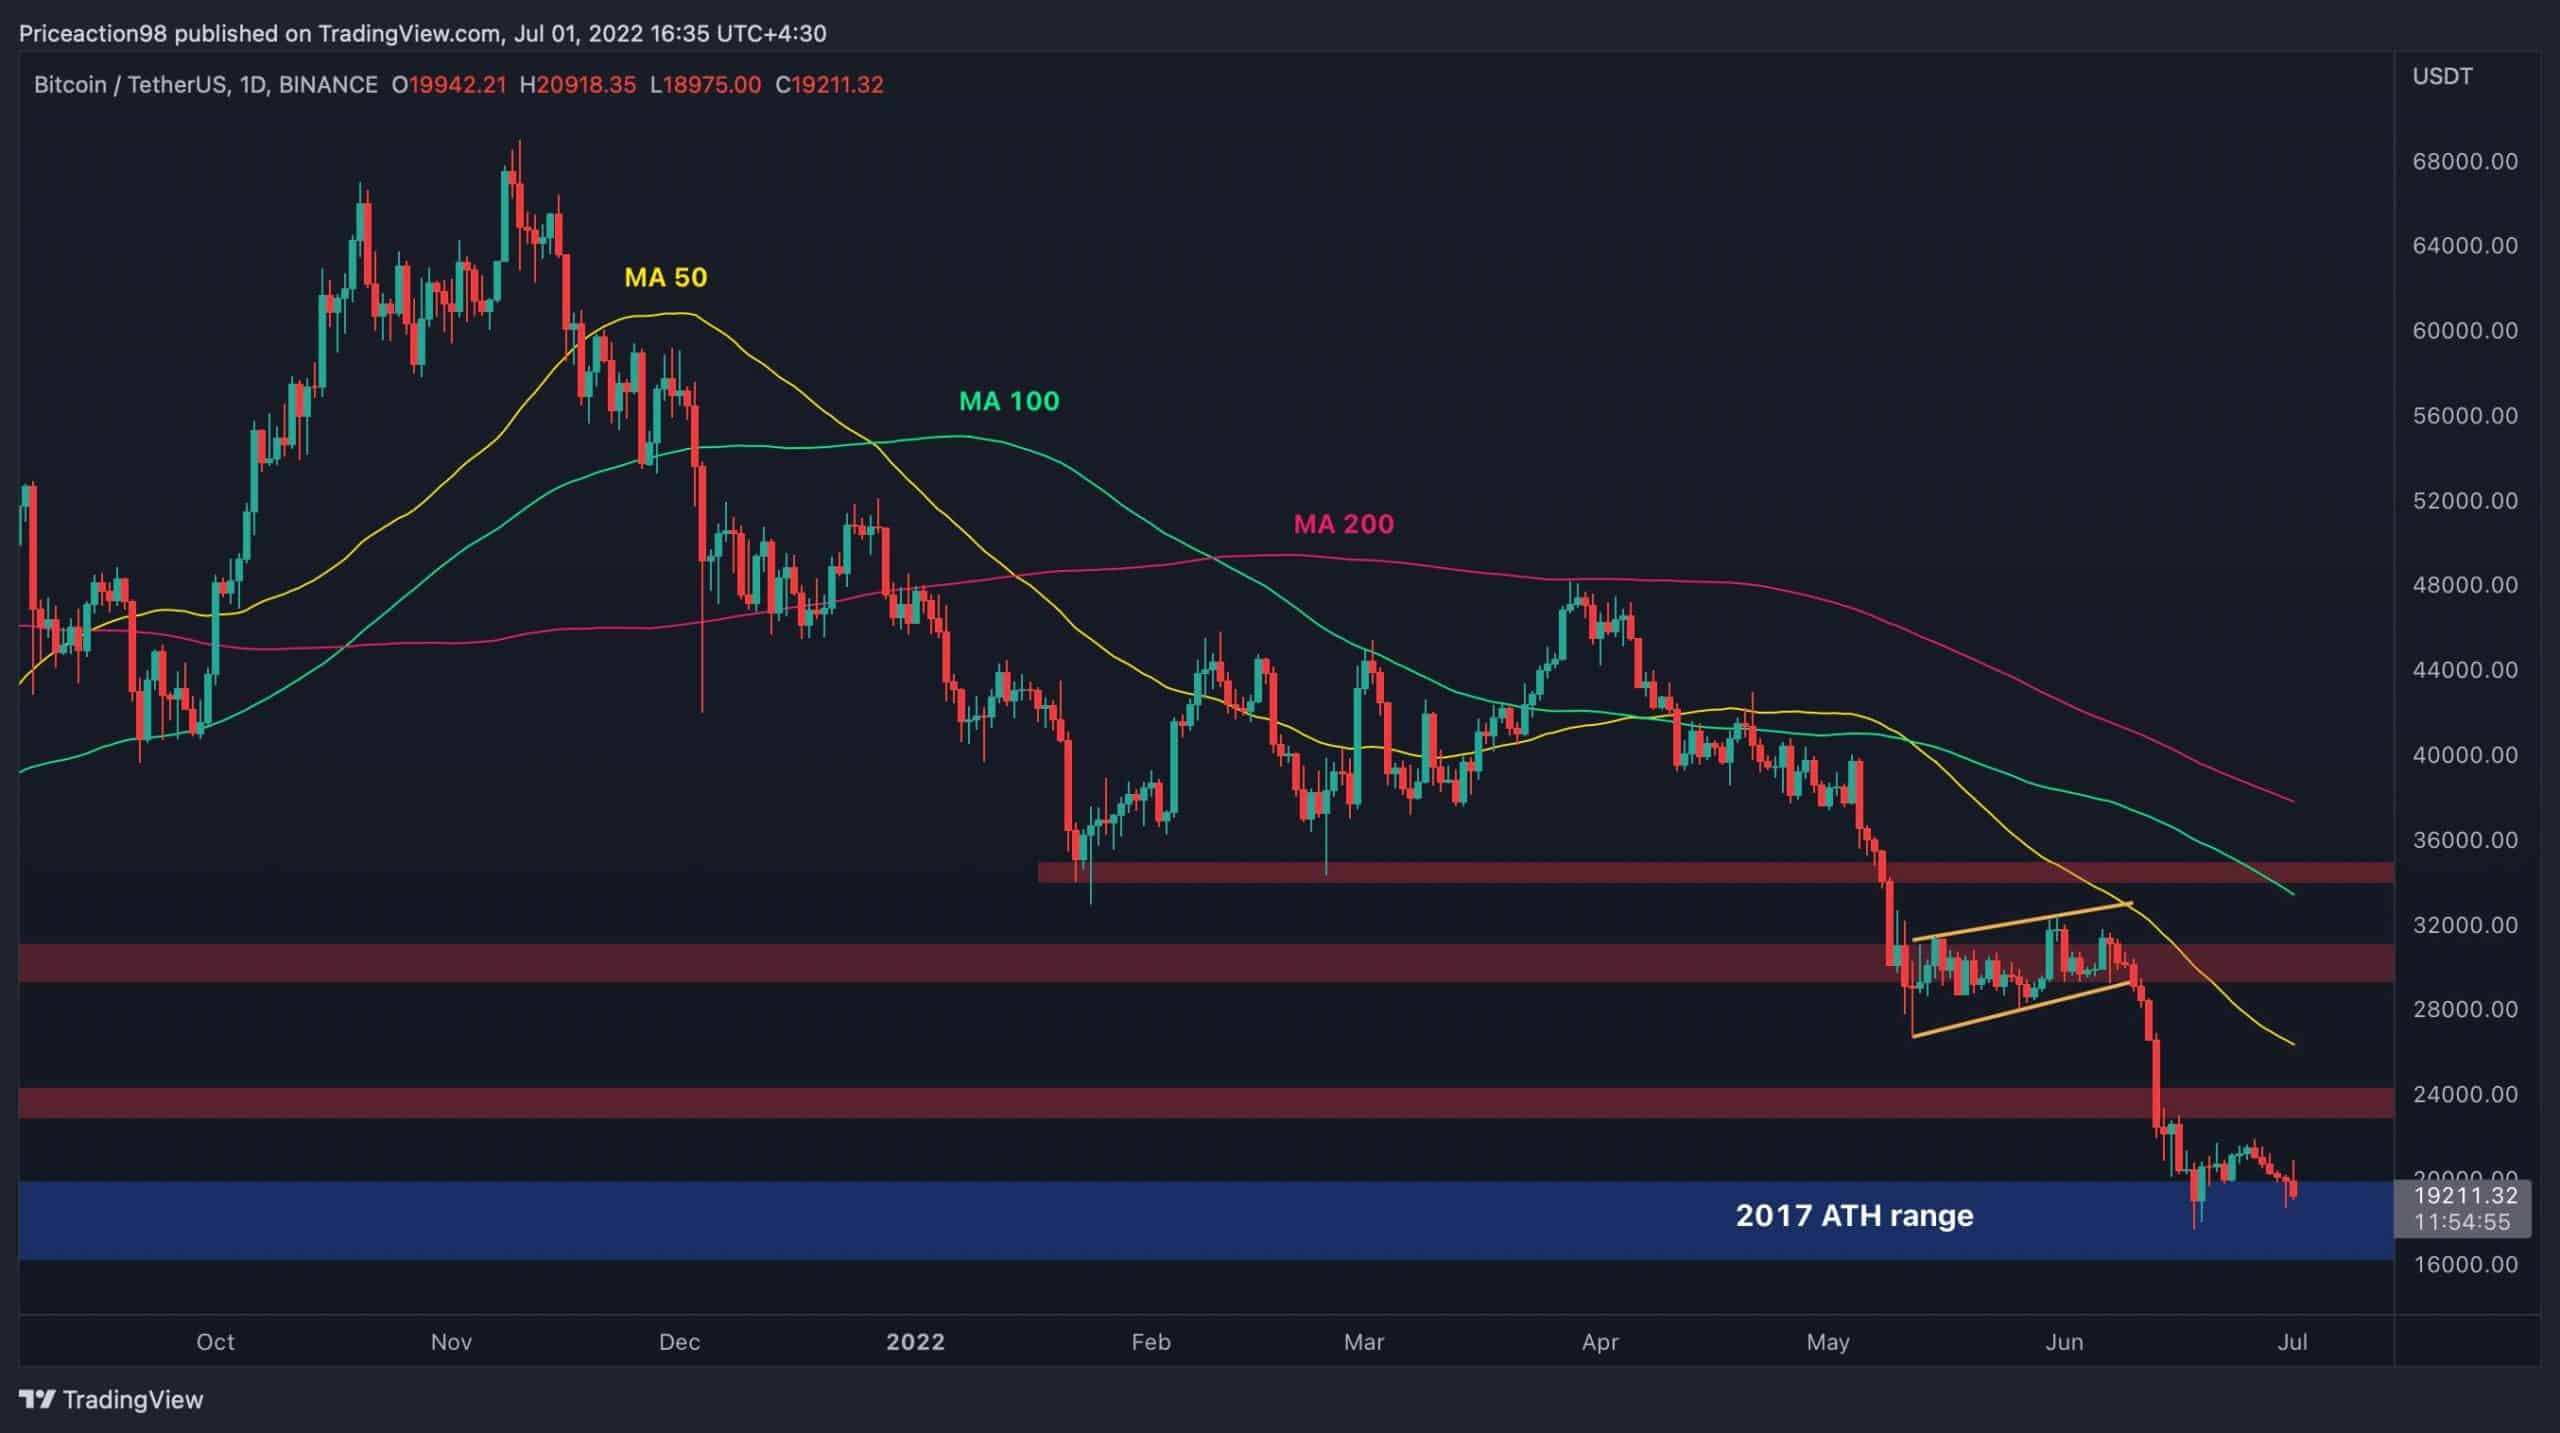
The $17.5K will be considered a key resistance if the price breaks it to the downside. Accordingly, a further drop towards the $15K range and even lower levels could be anticipated in the mid-term. However, a fake breakout and quick reversal is also possible, a pattern that could initiate a rally in the short term. Although, even in this case, the $24K and $30K static resistance levels and the 50-day moving average, currently around $26K, would be critical obstacles. The probability of a bullish reversal is very low before the price breaks above the $30K level.
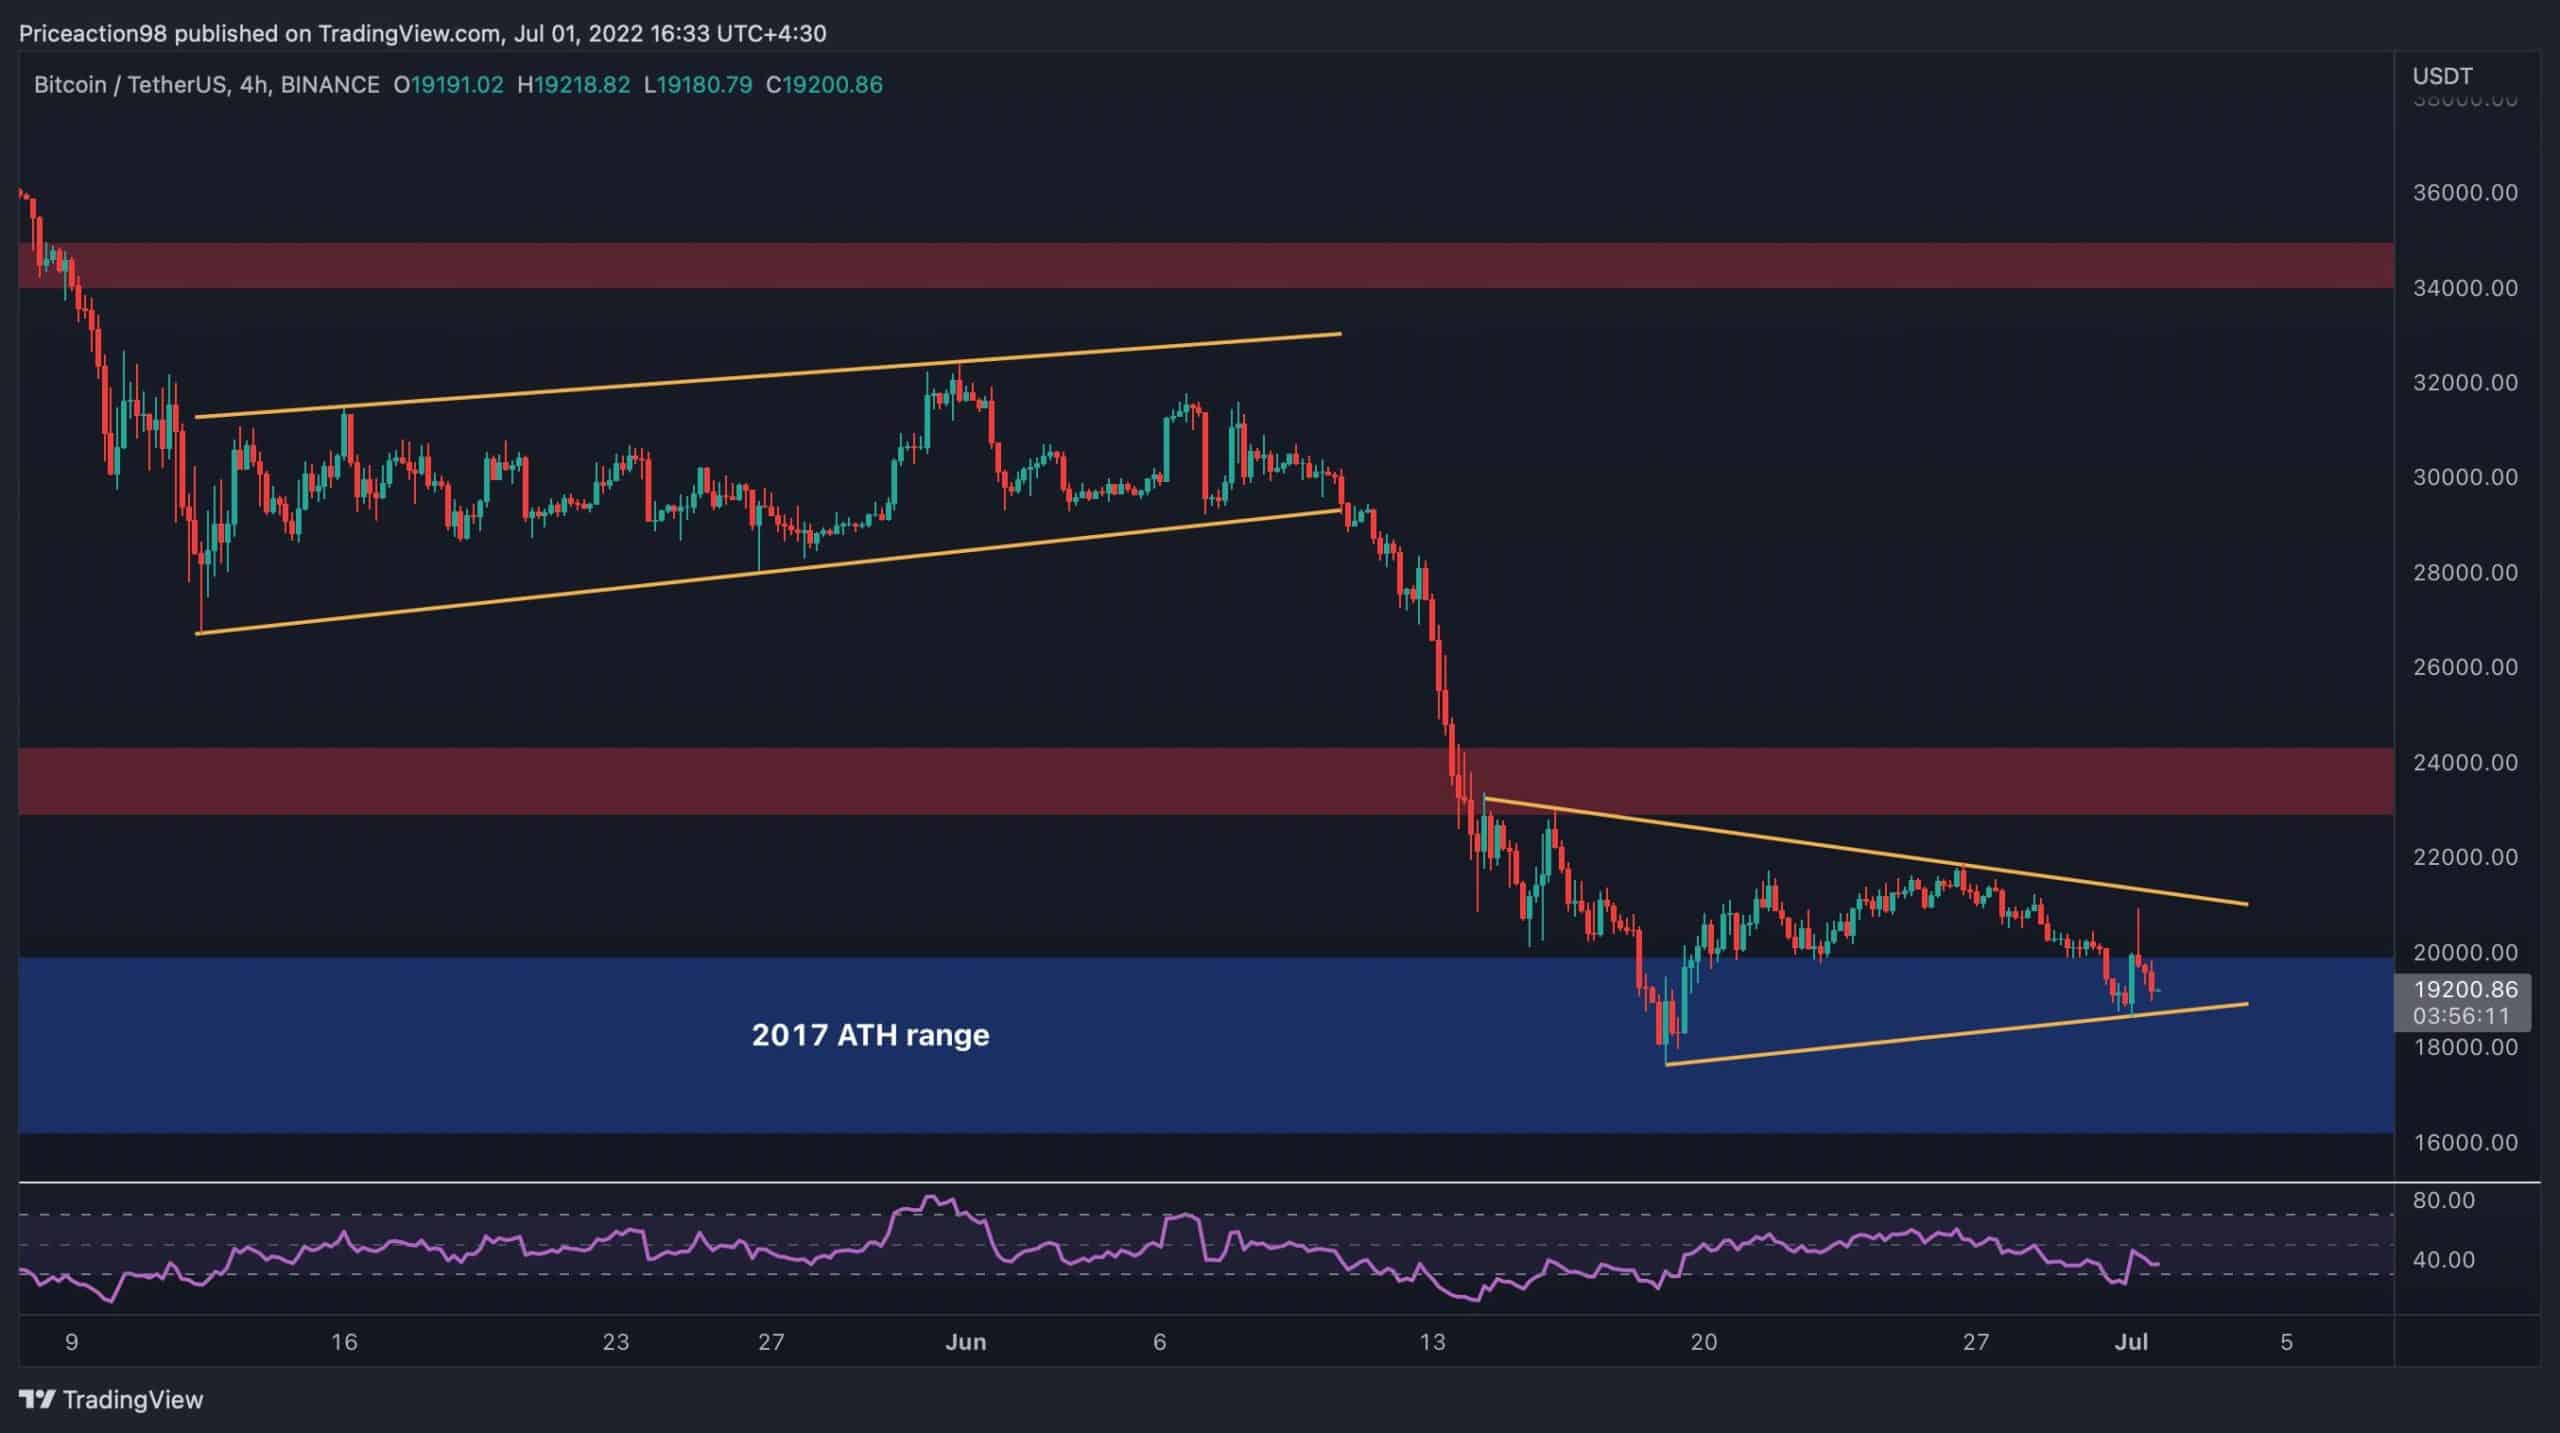
On the 4-hour timeframe, the price is consolidating in the $17K-$20K range, forming a triangle pattern. This could be a reversal or a continuation pattern.
A bullish breakout’s targets would be the $24K zone and then the $30K area where the previous bearish flag formed earlier.
On the other hand, a bearish breakdown would cause the price to drop rapidly towards $17.5K. The RSI indicator also shows values below 50%, which points to a relative dominance by the bears. This structure suggests the probability of a bearish breakout is relatively higher.
By Edris
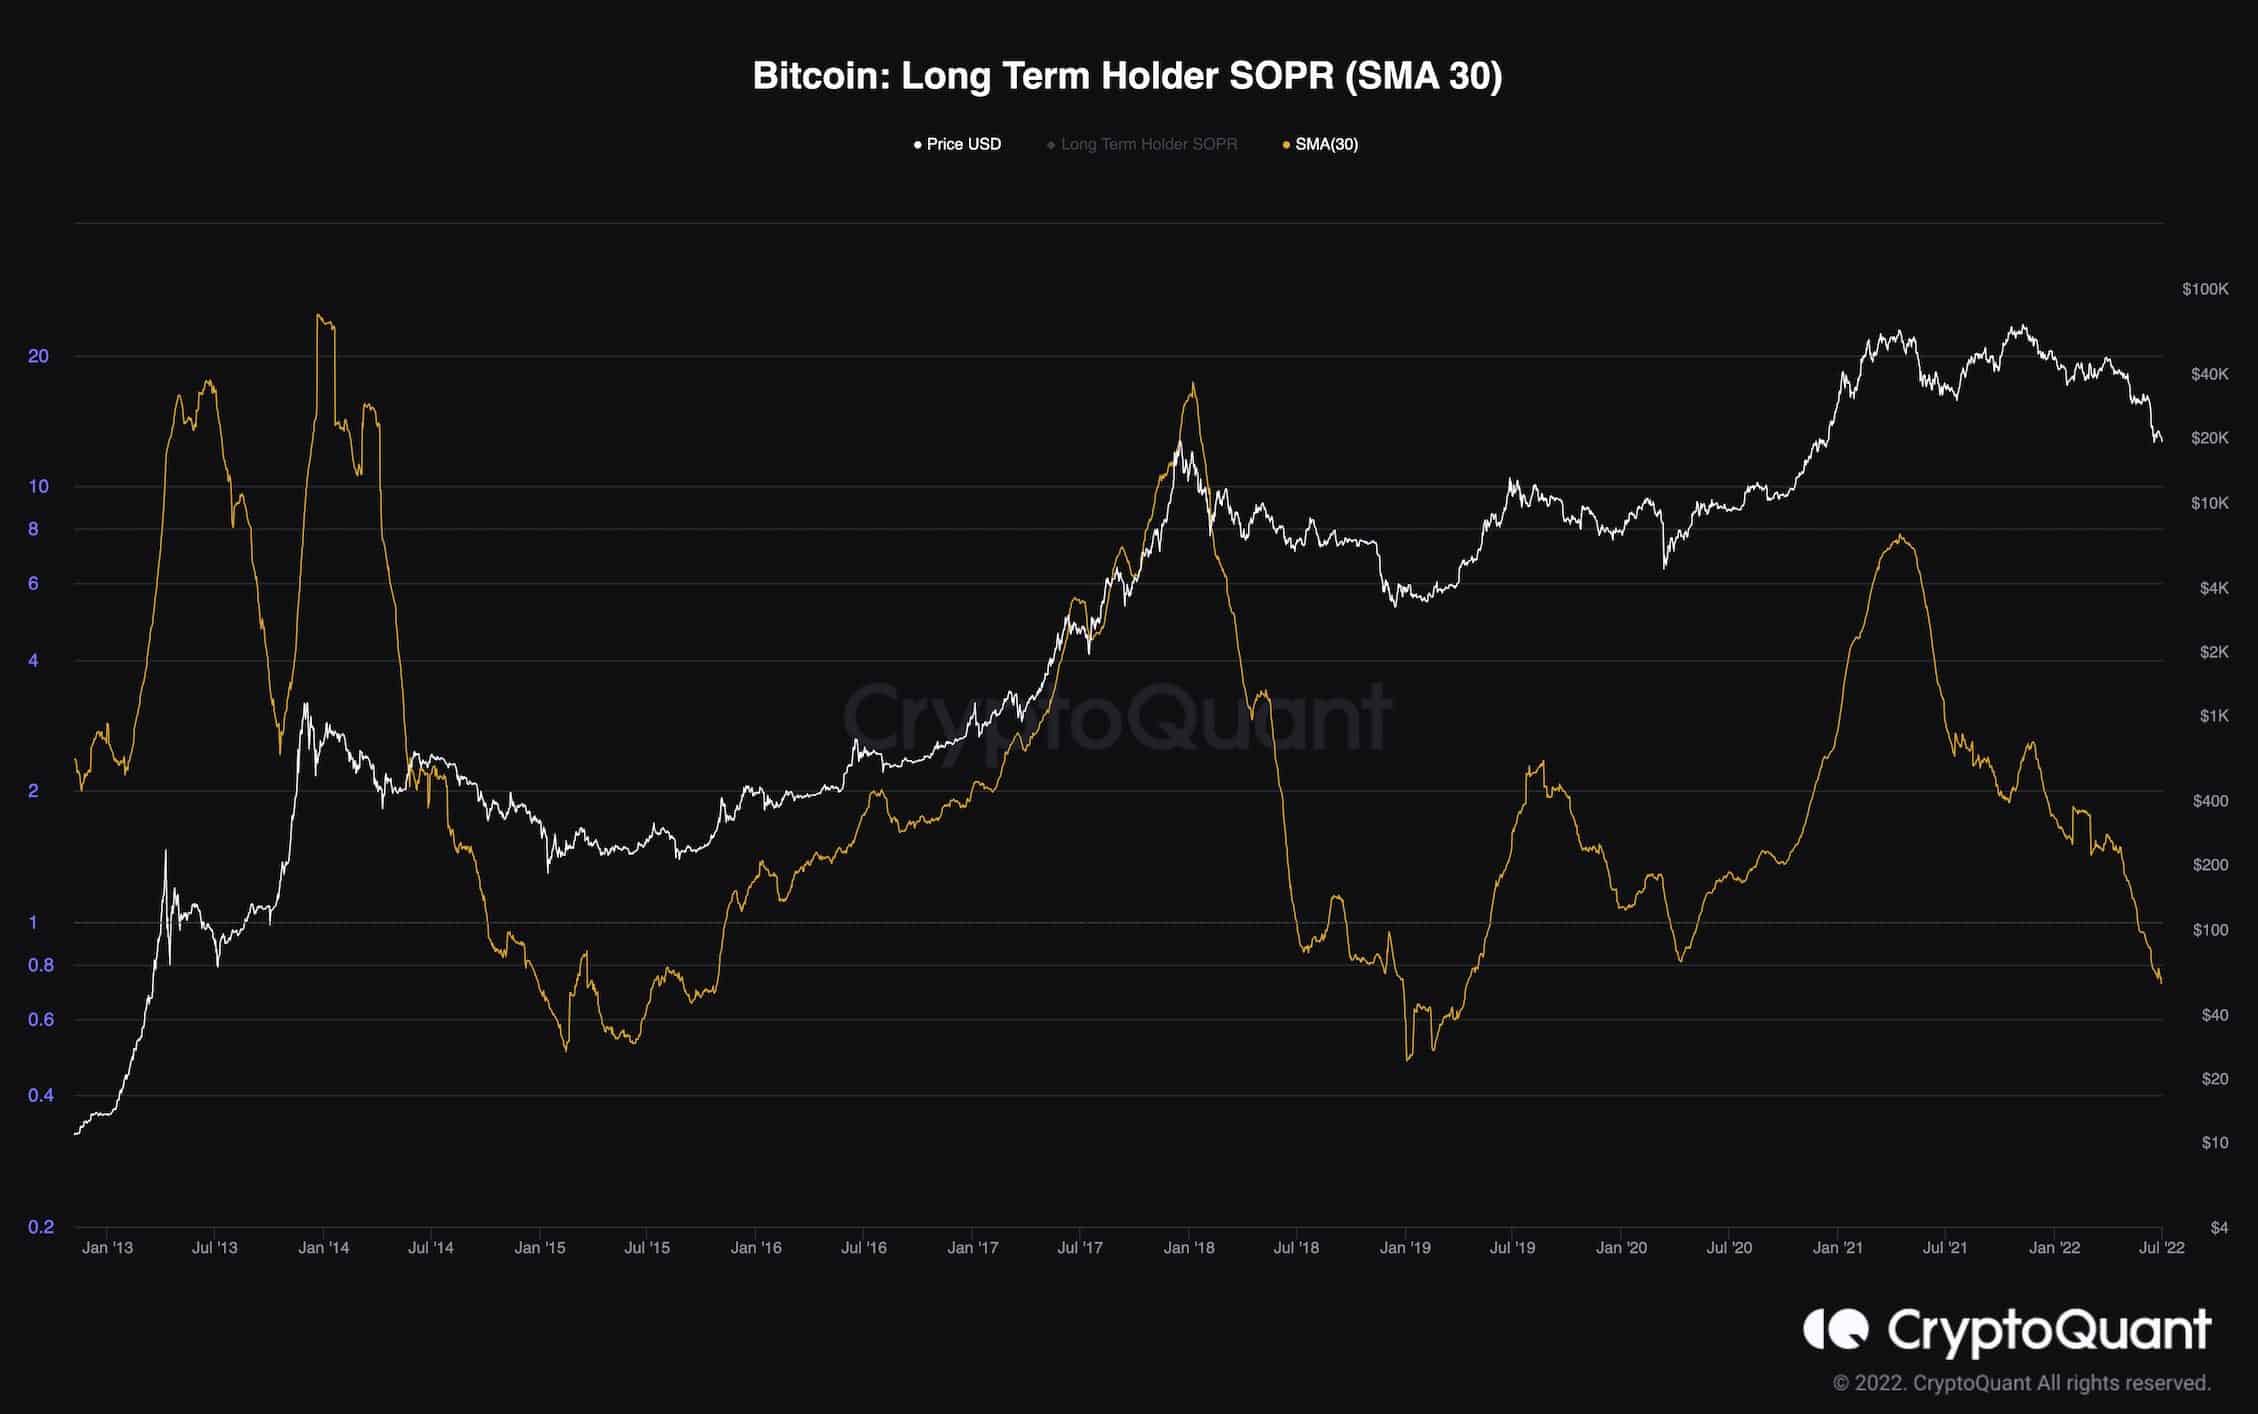
Bitcoin’s ruthless downtrend in the past few months has led to massive realized losses by investors. Even the long-term holders, a cohort that usually spends their coins in profit, are currently realizing losses. This behavior often occurs during the last phase of a bear market, a period in which even the long-term holders begin panic selling or “capitulating.”
These holders typically have large amounts of Bitcoin because they’ve probably accumulated their coins at lower prices and have held them for a long time. So, they would inject a significant supply into the market, which would usually trigger the bear market’s last crash.
Eventually, the bottom would form when the smart money accumulates these cheap coins. The long-term holders’ SOPR metric demonstrates the intensity of profits or losses realized by this cohort. This metric is currently trending below 1, indicating that the long-term holders are realizing losses daily, which points to more pain and decline in the short term and a potential bottom in the near future.