CryptoPotato
CryptoPotato
  • Crypto News
  • Margin Trading
  • Guides
    • Bitcoin & Crypto Guides 101
    • Bitcoin For Beginners
    • Editorials
  • DeFi & NFT
  • Buy
  • Language
    • Spanish
    • Turkish
    • German
    • Bulgarian
  • Crypto News
  • Bitcoin For Beginners
  • Cryptocurrency Guides 101
  • Editorials
  • Bitcoin & Crypto Margin Trading
  • DeFi & NFT News
  • Bitcoin Price Analysis
  • Ethereum (ETH) Price Analysis
  • Ripple (XRP) Price Analysis
  • Market Updates
  • Interviews
  • Buy Bitcoin with Card
  • CryptoPotato Spanish
  • CryptoPotato Turkey
  • CryptoPotato Germany
  • CryptoPotato Bulgaria
  • Market Updates
  • BTC Analysis
  • ETH Analysis
  • XRP Analysis
  • Interviews
CryptoPotato
CryptoPotato
  • Crypto News
  • Margin Trading
  • Guides
    • Bitcoin & Crypto Guides 101
    • Bitcoin For Beginners
    • Editorials
  • DeFi & NFT
  • Buy
  • Language
    • Spanish
    • Turkish
    • German
    • Bulgarian
  • Crypto News
  • Bitcoin For Beginners
  • Cryptocurrency Guides 101
  • Editorials
  • Bitcoin & Crypto Margin Trading
  • DeFi & NFT News
  • Bitcoin Price Analysis
  • Ethereum (ETH) Price Analysis
  • Ripple (XRP) Price Analysis
  • Market Updates
  • Interviews
  • Buy Bitcoin with Card
  • CryptoPotato Spanish
  • CryptoPotato Turkey
  • CryptoPotato Germany
  • CryptoPotato Bulgaria
Home » BTC » BTC Fails At $49-50k Resistance, But Weekly Chart Showing Strength (Bitcoin Price Analysis)

BTC Fails At $49-50k Resistance, But Weekly Chart Showing Strength (Bitcoin Price Analysis)

Author: DanBTC916

Last Updated Aug 30, 2021 @ 13:21
Getting your audio player ready...

BTC managed to make a third weekly close above the 21-week and 200-day moving average as the largest cryptocurrency continues the bull market continuation validation phase.

After rallying higher for 5 consecutive weeks with near-term momentum slowing and bearish divergence on the 4-hour chart, consolidation can be expected. Resistance at $50k continues to be the near-term level that BTC must successfully close above in order to follow up on the breakout and bull market continuation.

What’s The Next Resistance for Bitcoin’s Price?

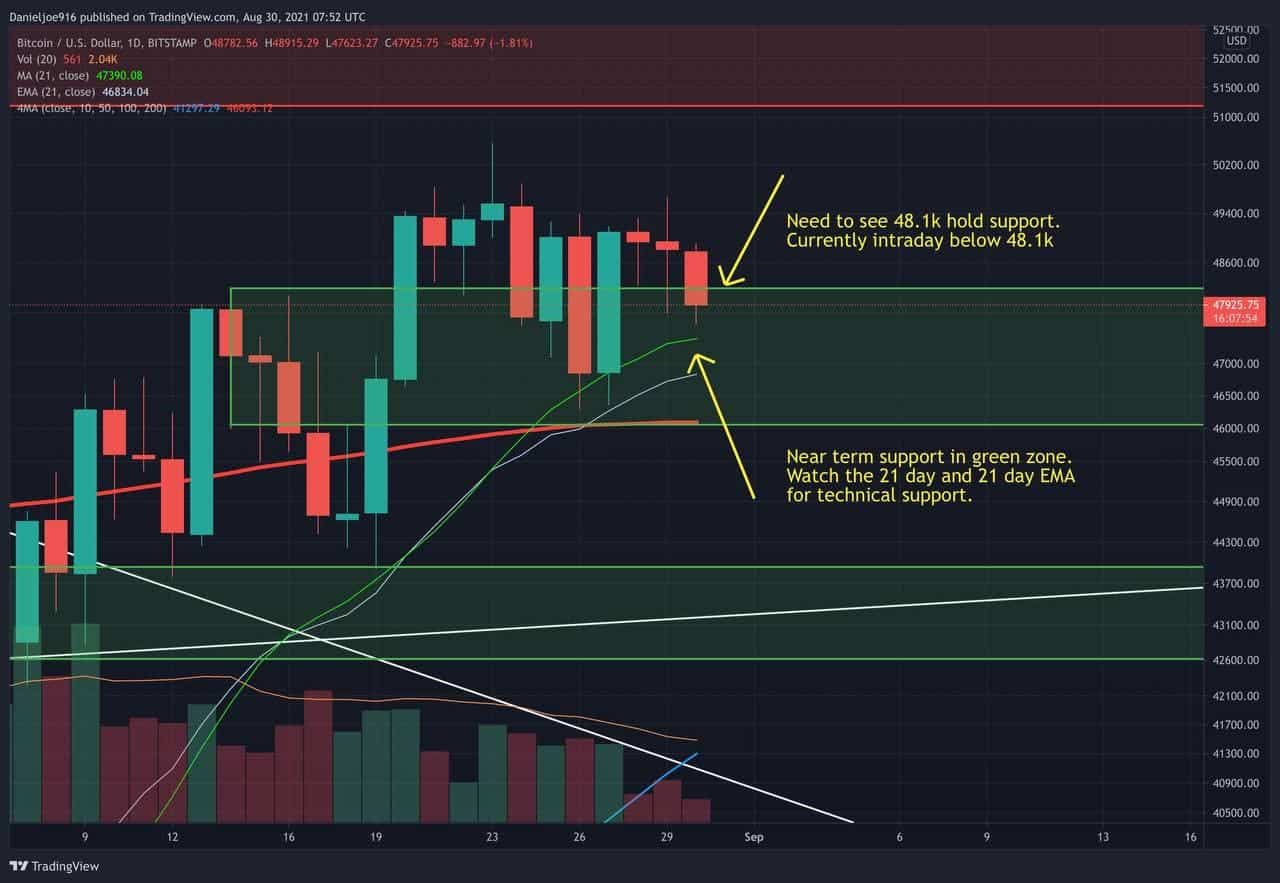
$48.1k has been a near-term level of support and resistance as BTC has traded in and out of this level multiple times during the week. So far, the price has held the green zone of support between $48.1k and $46k, a positive consolidation signal.

img1
Chart by TradingView

Technical analysts have warned of a potential pullback to the $42k area as a large rising wedge, and bearish divergence has been forming. This is something to watch closely, but we have to factor in aggregate on-chain data and BTC fundamentals which continue to show strength.

For a larger pullback to $42k to occur, BTC will need to close below the 200-day moving average currently at $46.1k. This will likely require a near-term catalyst such as a news event or a larger than expected long liquidation with low liquidity.

BTC bulls, instead, would like to see sideways consolidation between $47k to $50k, which will continue to help exhaust supply in this key range, and set up for another retest of $50k, potentially leading to a breakout to the $55k to $58k resistance zone.

It has been over 3 weeks since the Hash Ribbon flashed a bullish cross, triggering a long-term fundamental buy signal. BTC is up by 8.8% since the buy signal flashed, which is impressive considering previous signals have led to multi-week or month-long consolidations before a larger rally. The BTC hash rate is expected to push higher as more miners plug into the network after the migration out of China.

Consistent demand for mining hardware and facilities continues to suggest Bitcoin miners are bullish on the long-term outlook for BTC. Even with a near-term correction from $50.5k to $46.3k, miner reserves remained flat, slightly below 1.85 million BTC. This can be seen as a very bullish signal considering the increase in mining difficulty, which can lower the amount of BTC rewarded to miners depending on computing power generated.

Long-Term Momentum Showing Improvement

The weekly chart continues to improve, with the WMA convergence divergence indicator forming a bullish cross and trending higher. If BTC can hold current levels and continue its upward direction, weekly momentum is expected to flash a bullish pulse, suggesting a powerful rally could be coming in the months ahead.

SPECIAL OFFER (Sponsored)
Binance Free $600 (CryptoPotato Exclusive): Use this link to register a new account and receive $600 exclusive welcome offer on Binance (full details).

LIMITED OFFER for CryptoPotato readers at Bybit: Use this link to register and open a $500 FREE position on any coin!


Disclaimer: Information found on CryptoPotato is those of writers quoted. It does not represent the opinions of CryptoPotato on whether to buy, sell, or hold any investments. You are advised to conduct your own research before making any investment decisions. Use provided information at your own risk. See Disclaimer for more information.

Cryptocurrency charts by TradingView.
Tags: Bitcoin (BTC) Price
Enjoy reading? Share with your friends
Facebook Twitter LinkedIn Telegram

About The Author

DanBTC916
More posts by this author

Dan is a cryptocurrency Onchain/Technical analyst at a Crypto Fund with 11 years of experience in equity markets and over 4 years in crypto markets. Dan’s background and deep understanding of Finance and Economics have sparked a deep passion for the cryptocurrency markets, especially in Bitcoin. Follow Dan on Twitter

Join Our Community

FacebookX YouTubeTelegram


Editorials
How to Farm Airdrops on Hyperliquid (HYPE): The Complete Guide to Free Money This Crypto Cycle

How to Farm Airdrops on Hyperliquid (HYPE): The Complete Guide to Free Money This Crypto Cycle

How to Trade on Hyperliquid: The Ultimate Guide (Step-by-Step Walkthrough)

How to Trade on Hyperliquid: The Ultimate Guide (Step-by-Step Walkthrough)

11 Best Meme Coins to Watch in June 2025

11 Best Meme Coins to Watch in June 2025

7 Best Meme Coin Presales to Watch in June 2025

7 Best Meme Coin Presales to Watch in June 2025

Toobit Review 2025: Is Toobit a Safe Crypto Exchange?

Toobit Review 2025: Is Toobit a Safe Crypto Exchange?

Hyperliquid Bridge: How to Bridge USDC to Hyperliquid

Hyperliquid Bridge: How to Bridge USDC to Hyperliquid

11 Best Crypto Presales to Consider in June 2025

11 Best Crypto Presales to Consider in June 2025

Join Our Newsletter
Become a CryptoPotato VIP
One Weekly Email Can Change Your Crypto Life.
Sign-up FREE to receive our extended weekly market update and coin analysis report
We NEVER send spam. You can unsubscribe at any time.
Invalid email address
Thanks for subscribing!
Footer Logo
About
Advertise on CryptoPotato
About Us | Contact Us | Careers
Editorial Policy
Terms of service | Privacy Policy | GDPR
More Sections
IEO List | Evaluations
Airdrops
Scholarship
Disclaimer
Disclaimer: Information found on CryptoPotato is those of writers quoted. It does not represent the opinions of CryptoPotato on whether to buy, sell, or hold any investments. You are advised to conduct your own research before making any investment decisions. Use provided information at your own risk. Full disclaimer
© Copyright CryptoPotato 2016 - 2025
Scroll to top
One Daily Email Can Change Your Crypto Life.

Sign-up FREE to receive our extended daily market update and coin analysis report

We never send SPAM. You can unsubscribe at any moment
Invalid email address
Thanks for subscribing!