Bitcoin’s price has been making higher highs and lows consistently over the past few months. However, the market is currently consolidating around a key resistance level, failing to continue higher.
By TradingRage
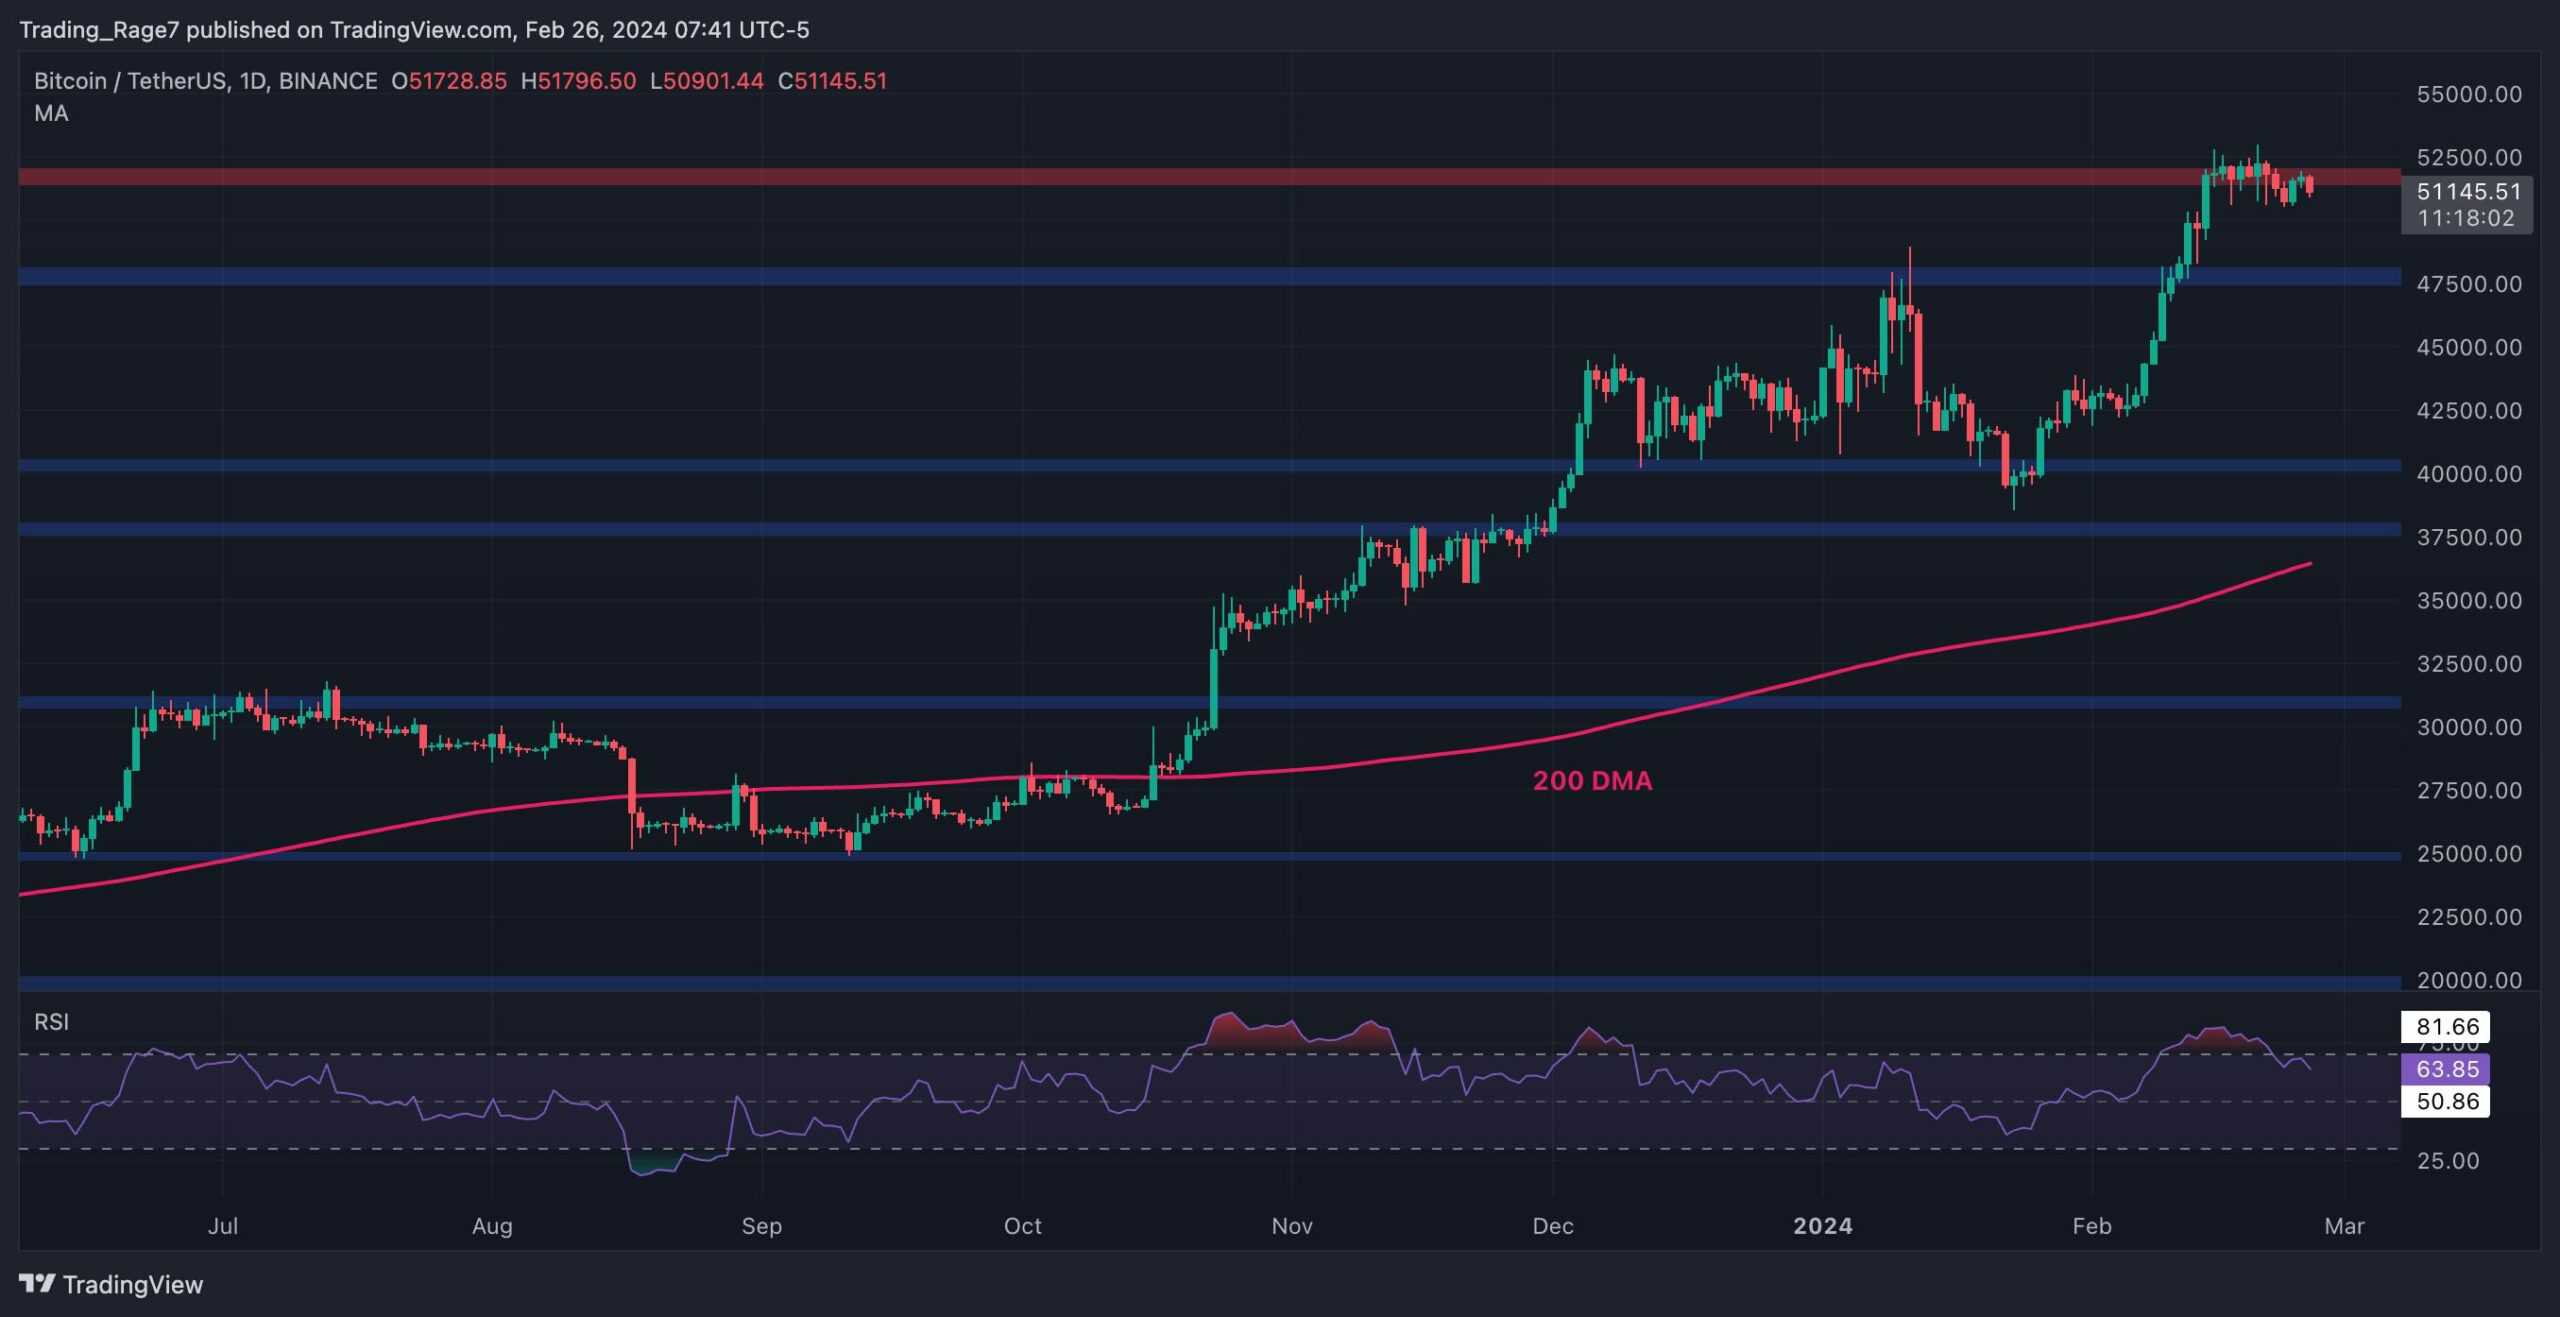
On the daily timeframe, the price has been breaking through several resistance levels since rebounding from the $40K support zone. Yet, the market is currently hovering around the $52K resistance level.
While there are no serious signs of climbing at the moment, the Relative Strength Index shows values above 50% that indicate higher prices might be achievable in the short term. Therefore, a breakout above the $52K resistance level is still probable.
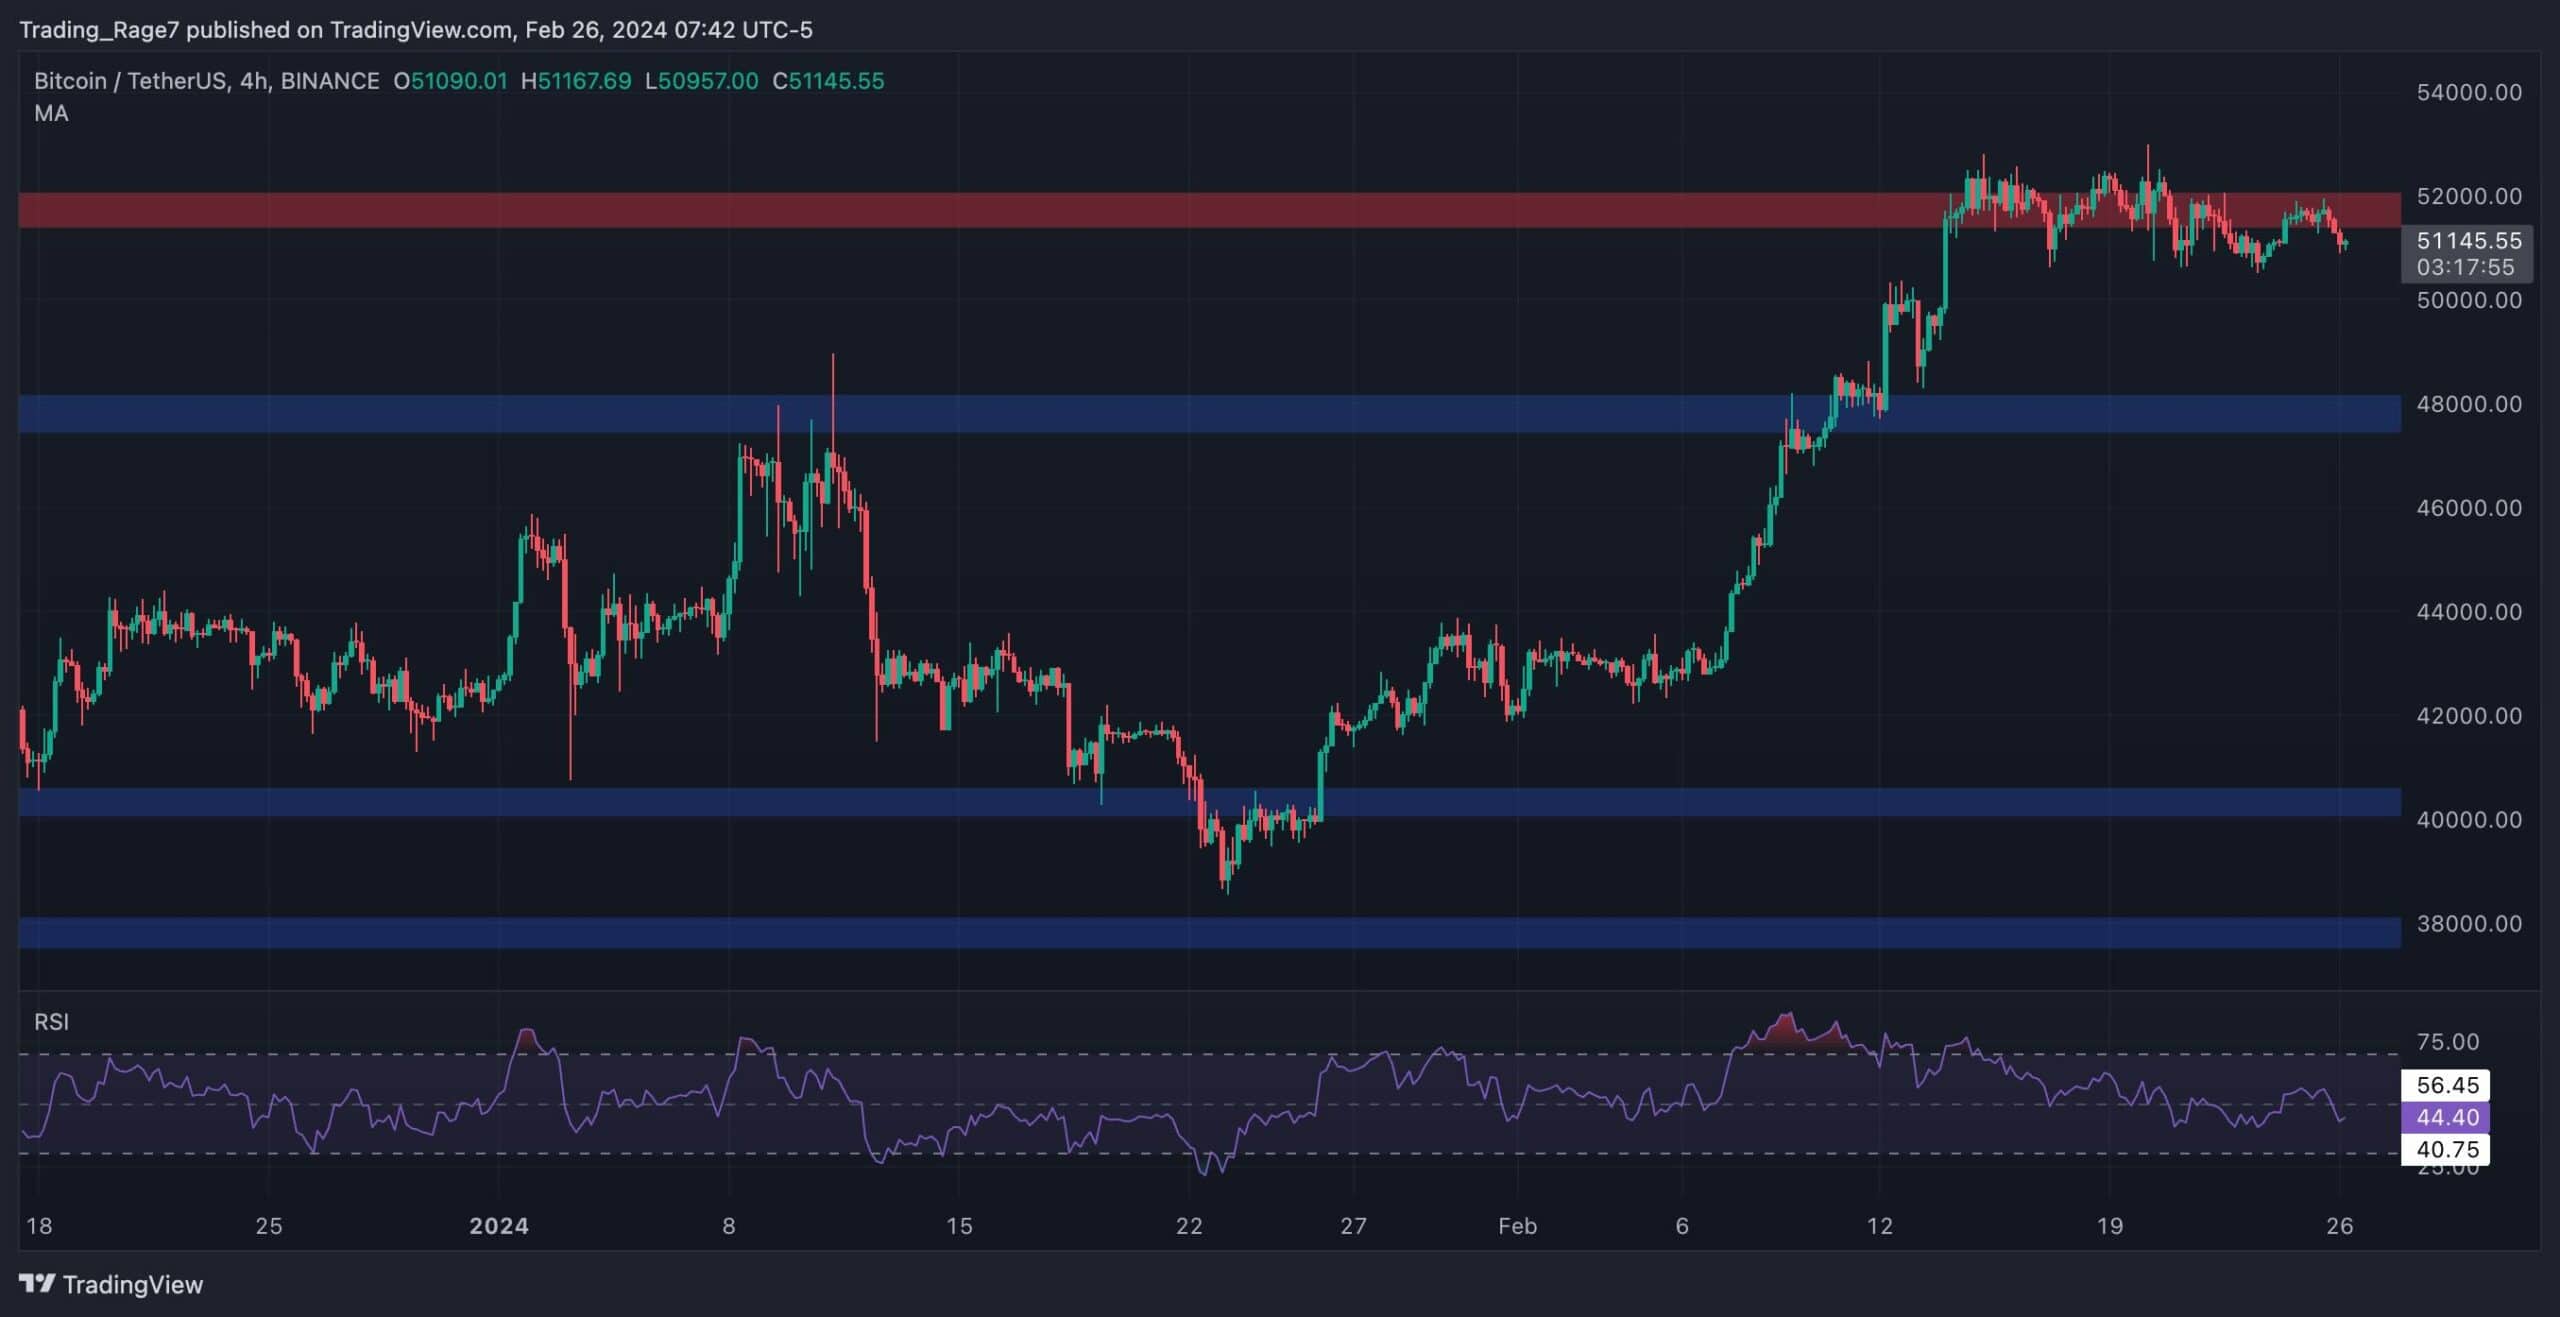
Looking at the 4-hour chart, it is evident that the price has been consolidating around the $52K level over the last couple of weeks.
In case of a correction, Bitcoin might pull back toward the $48K support level before potentially continuing higher. The Relative Strength Index has also dropped below the 50% level, hinting at a potential correction in the near future.
By TradingRage
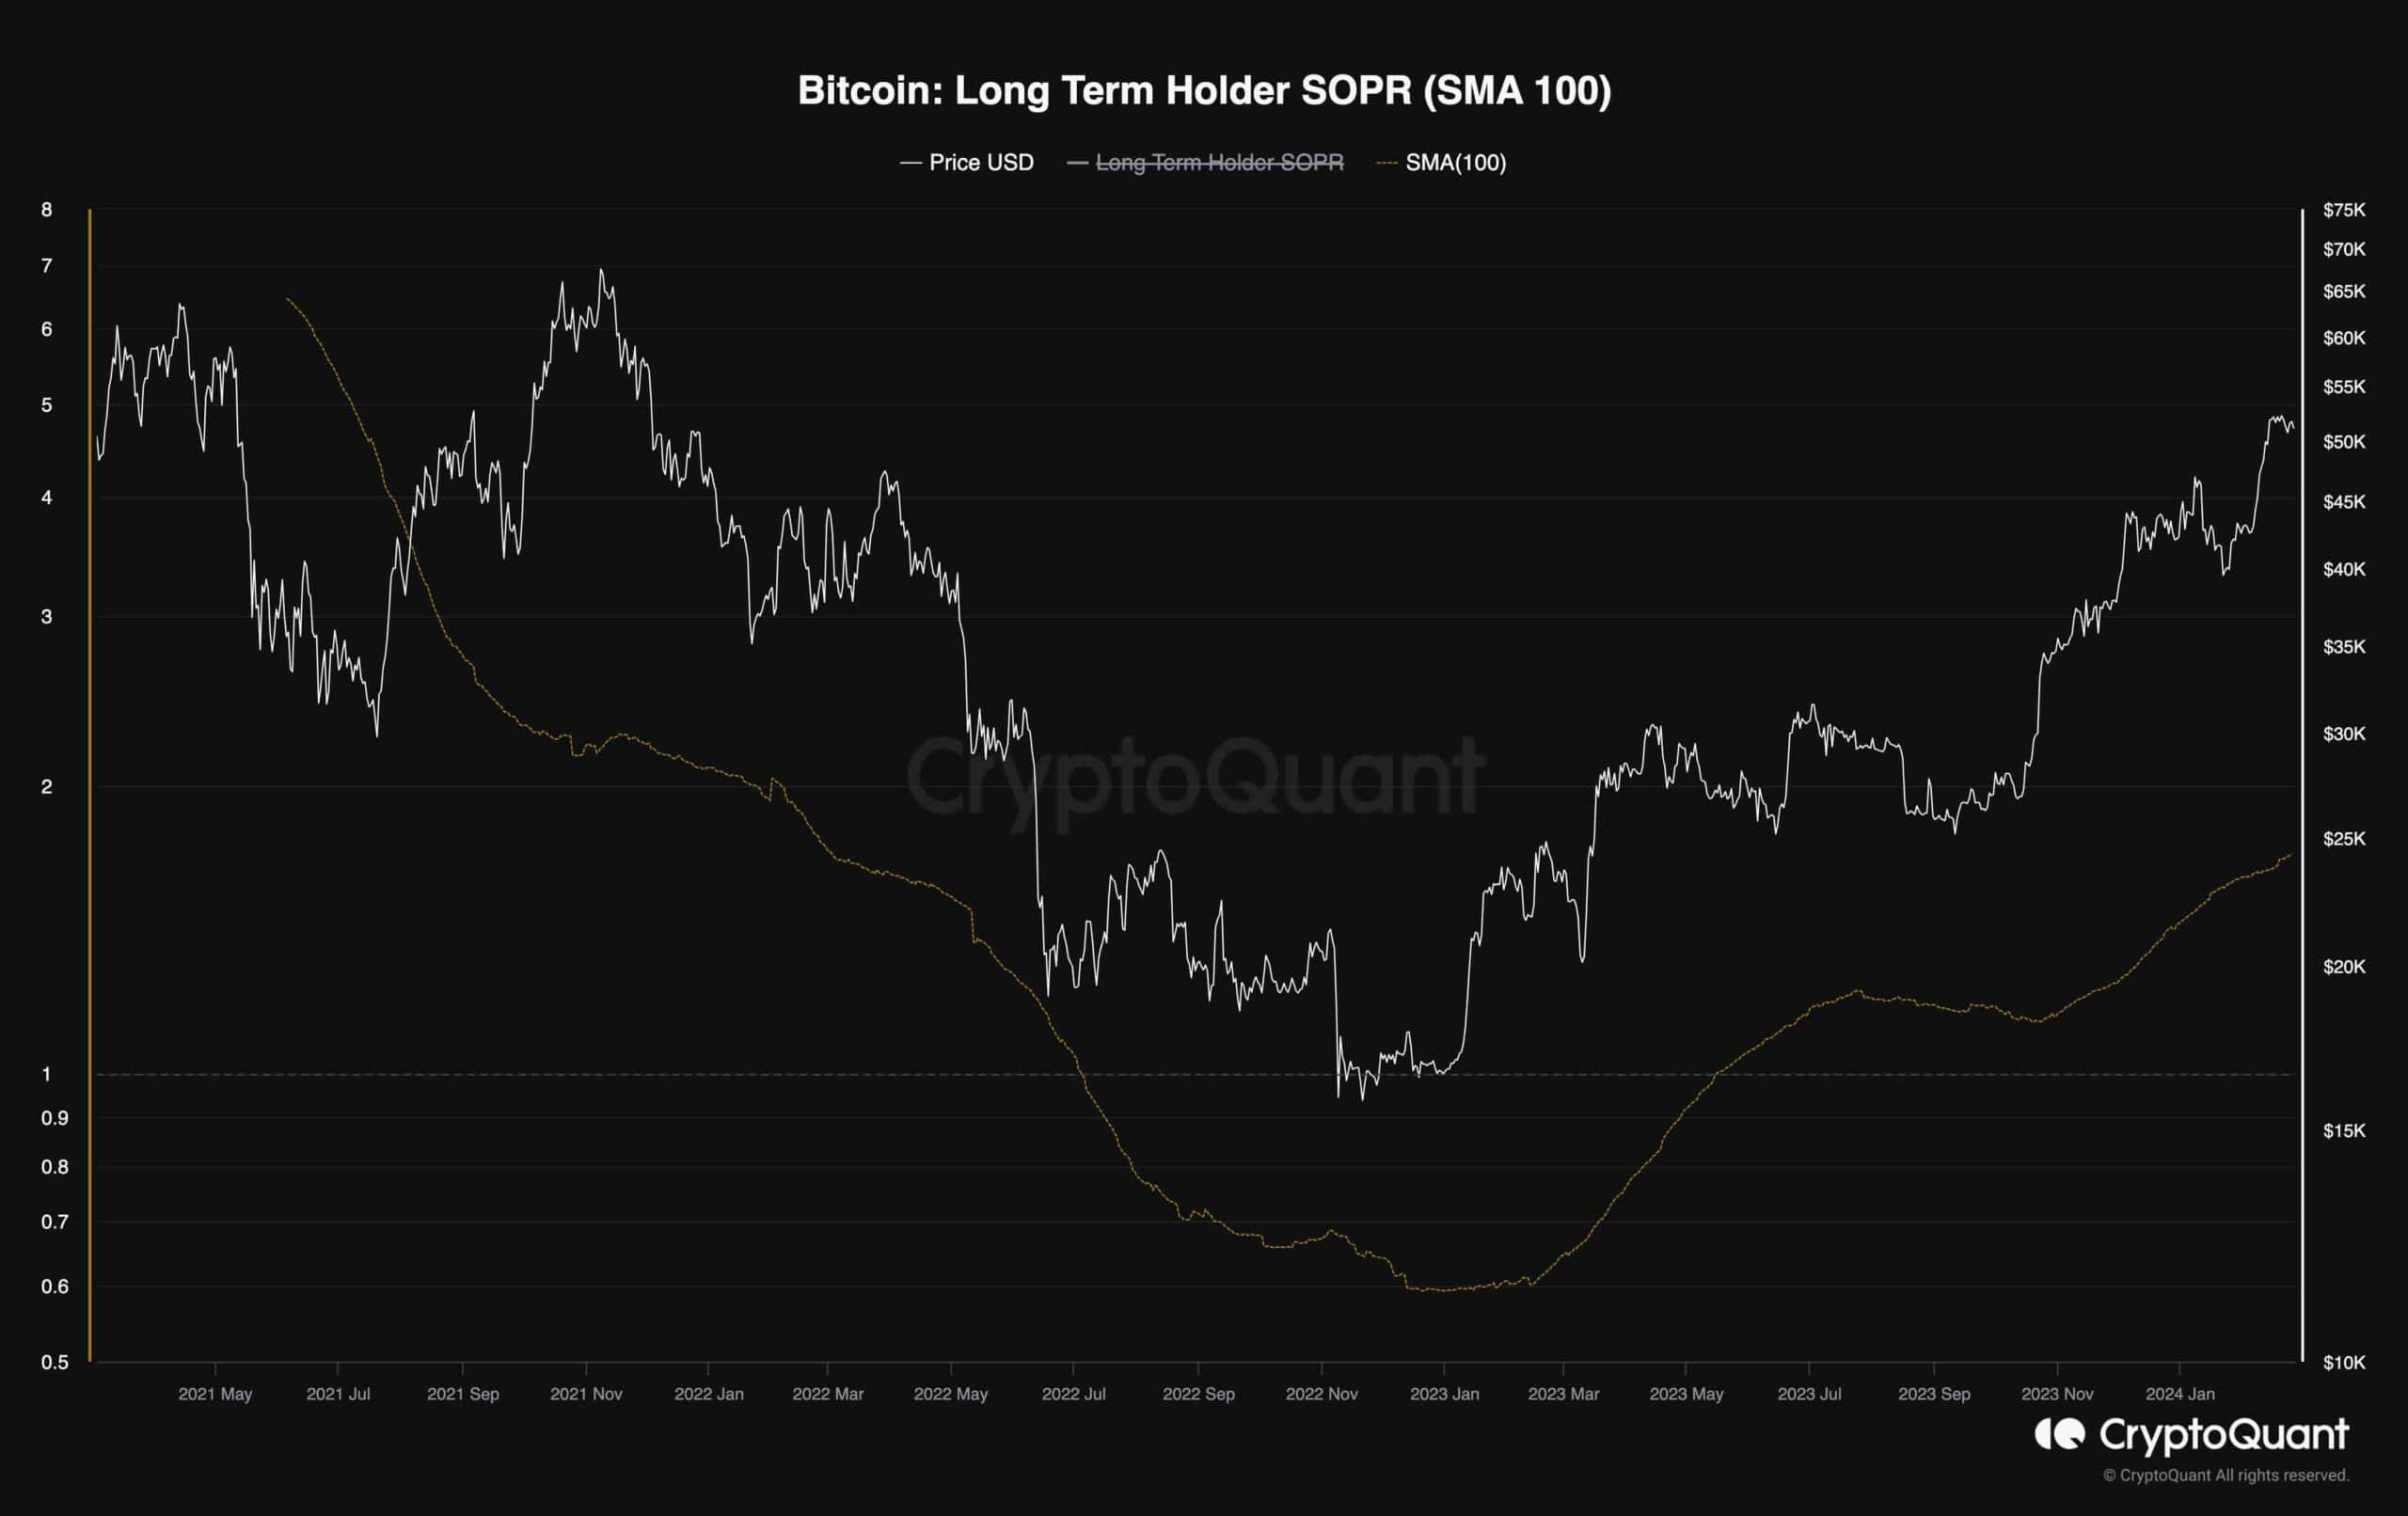
Bitcoin’s price has been rallying aggressively over the past few months and is approaching its all-time high of $69K. It would be beneficial to evaluate market sentiment to analyze supply and demand dynamics.
This chart demonstrates the Bitcoin Long-Term Holder SOPR, which measures the relative profits realized by long-term holders. It is evident that while the price is about to approach its all-time high, the LTH SOPR is still far behind.
Therefore, it can be interpreted that long-term holders are being patient for higher prices. As a result, their lack of supply can drive the market higher in the coming months.