Binance Coin (BNB) has finally broken above the elusive $20 resistance level in early today’s trading after rising by 6% over the past 24 hours. The coin is currently trading around a price of $20.70 after the cryptocurrency has seen a 30% monthly price surge.
Within the top 10 ranked projects by market-cap, Binance Coin remains the most serious performer over the past 90 days, after rising by an extraordinary 217%. The coin is now 20% from its all-time high at $25.
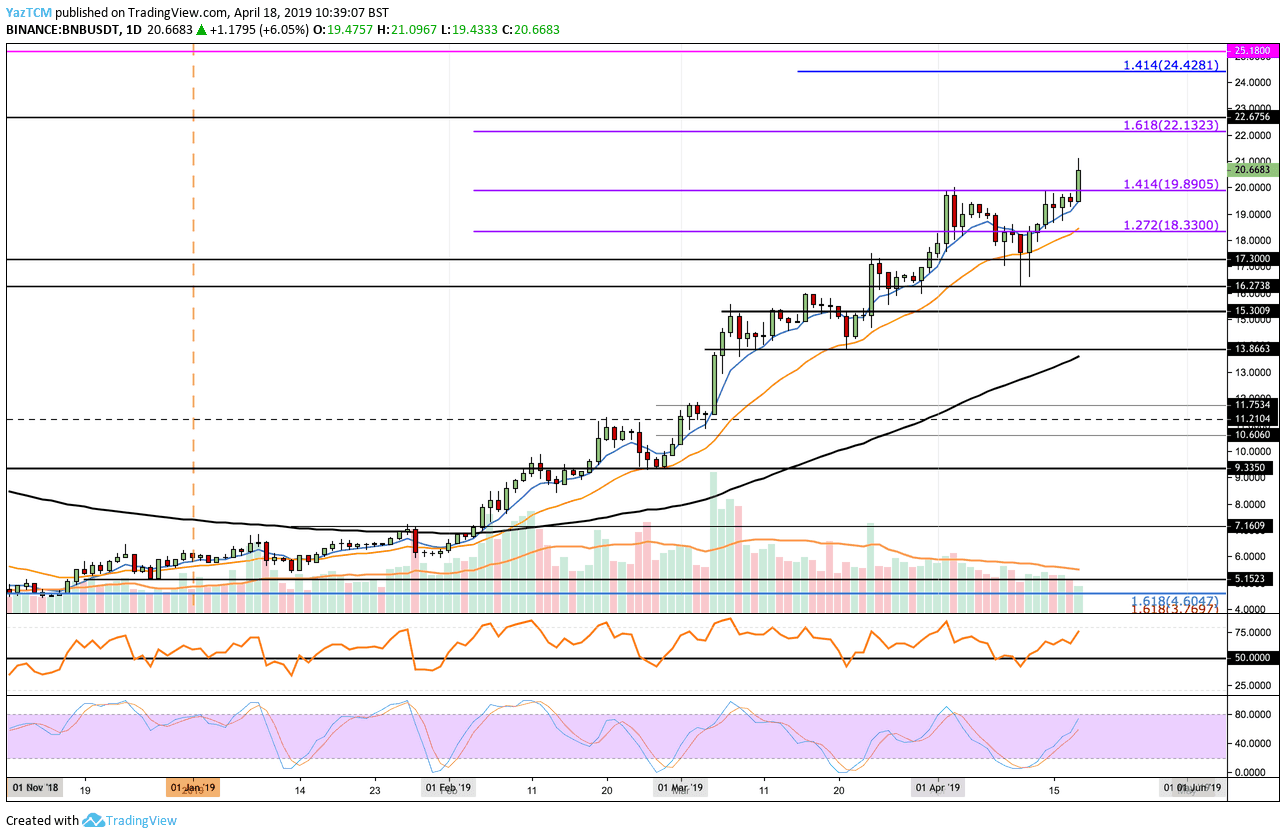
Looking at the BNB/USD 1-Day Chart:
- Since our previous BNB/USD price analysis, we can see that BNB/USD has managed to break above the resistance at $19.89 – $20 where lies a 1.414 Fibonacci Extension level.
- From above: The nearest level of resistance now lies at $21.00. Further resistance then lies at $22.13, along with a 1.618 Fibonacci Extension level. If the buyers continue above $23.00 and $24.00, we can then assume more resistance above at $24.42 followed by higher resistance at the previous ATH at $25.18.
- From below: The closest support now lies between $20.00 and $19.89. Below lies $19.00, $18.33, $17.30 and $16.27.
- The trading volume is close to the average level, not significant at this time.
- The RSI has recently bounced back above the 50 levels as the bulls remain in control of the market momentum. The Stochastic RSI had also recently initiated a crossover above which had signaled that BNB might break the $20 resistance level.
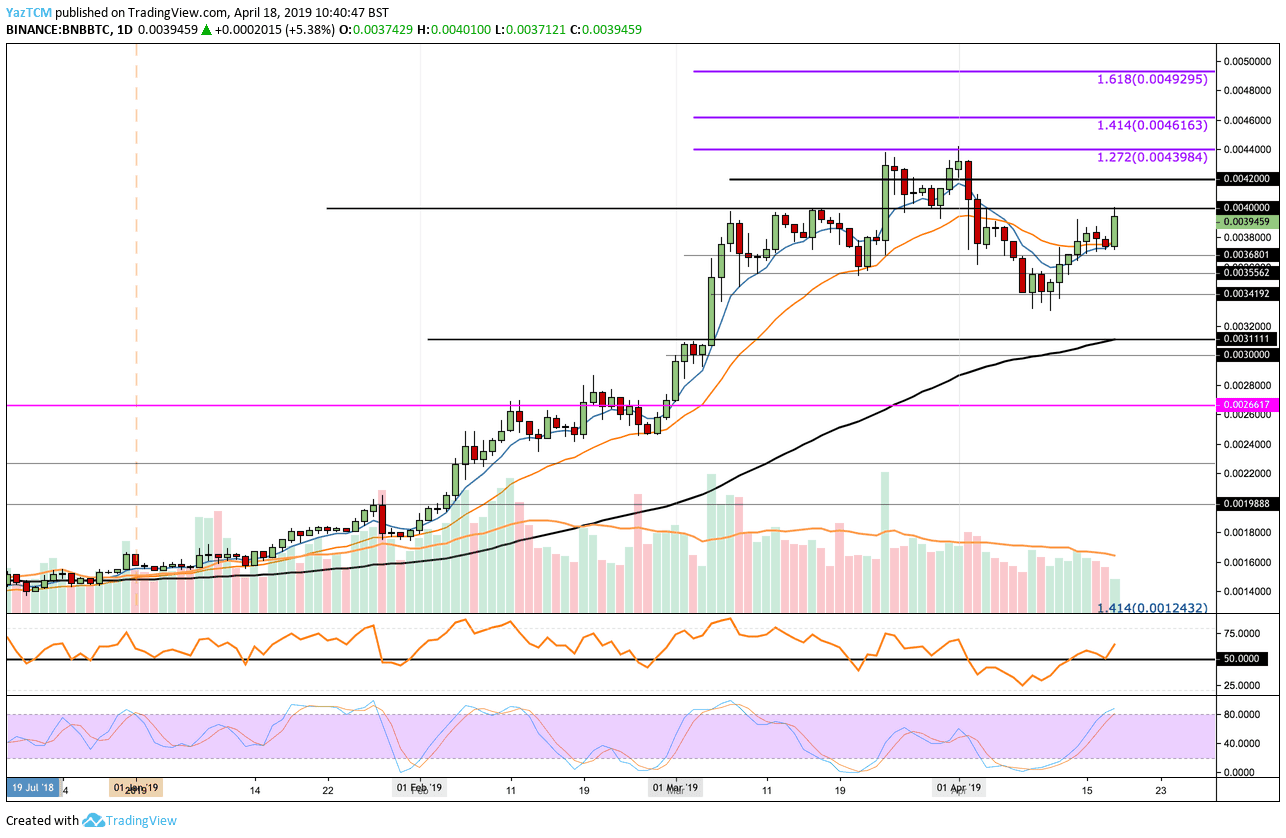
Looking at the BNB/BTC 1-Day Chart:
- Following our previous analysis, we can see that BNB/BTC has continued to climb higher and has recently reached the resistance at the 0.004 BTC level.
- From above: The nearest level of resistance now lies at 0.0042 BTC which is closely followed with further resistance at 0.0044 BTC (the Bitcoin’s all-time high). Above 0.0044 BTC, higher resistance lies at 0.0046 BTC (1.414 Fib Extension) and 0.004930 – 0.005 BTC (1.618 Fib Extension).
- From below: Initial support lies at 0.003680 BTC. Support below this is located at 0.003420 BTC and then at 0.003111 BTC which is further bolstered by the 100-days moving average line.
- The Stochastic RSI looks to be positioned to initiate a crossover below signal which could stall BNB/BTC progress. However, the RSI has recently bounced back above 50 which indicate that the bulls have regained momentum.
SPECIAL OFFER (Sponsored)
LIMITED OFFER 2024 for CryptoPotato readers at Bybit: Use this link to register and open a $500 BTC-USDT position on Bybit Exchange for free!
Disclaimer: Information found on CryptoPotato is those of writers quoted. It does not represent the opinions of CryptoPotato on whether to buy, sell, or hold any investments. You are advised to conduct your own research before making any investment decisions. Use provided information at your own risk. See Disclaimer for more information.
Cryptocurrency charts by TradingView.