Binance Coin continues to record significant gains following 70% monthly gains. The coin has now seen an impressive 230% price increase over the past 90 days. Binance Coin is currently trading for $17.30 as of writing this. The project is ranked in the 7th position of the largest cryptos by market cap, with a cap of $2.4 billion.
Following the break above the $17.47 resistance, Binance Coin tops a new 2019 and 15-month high against the USD at $17.73.
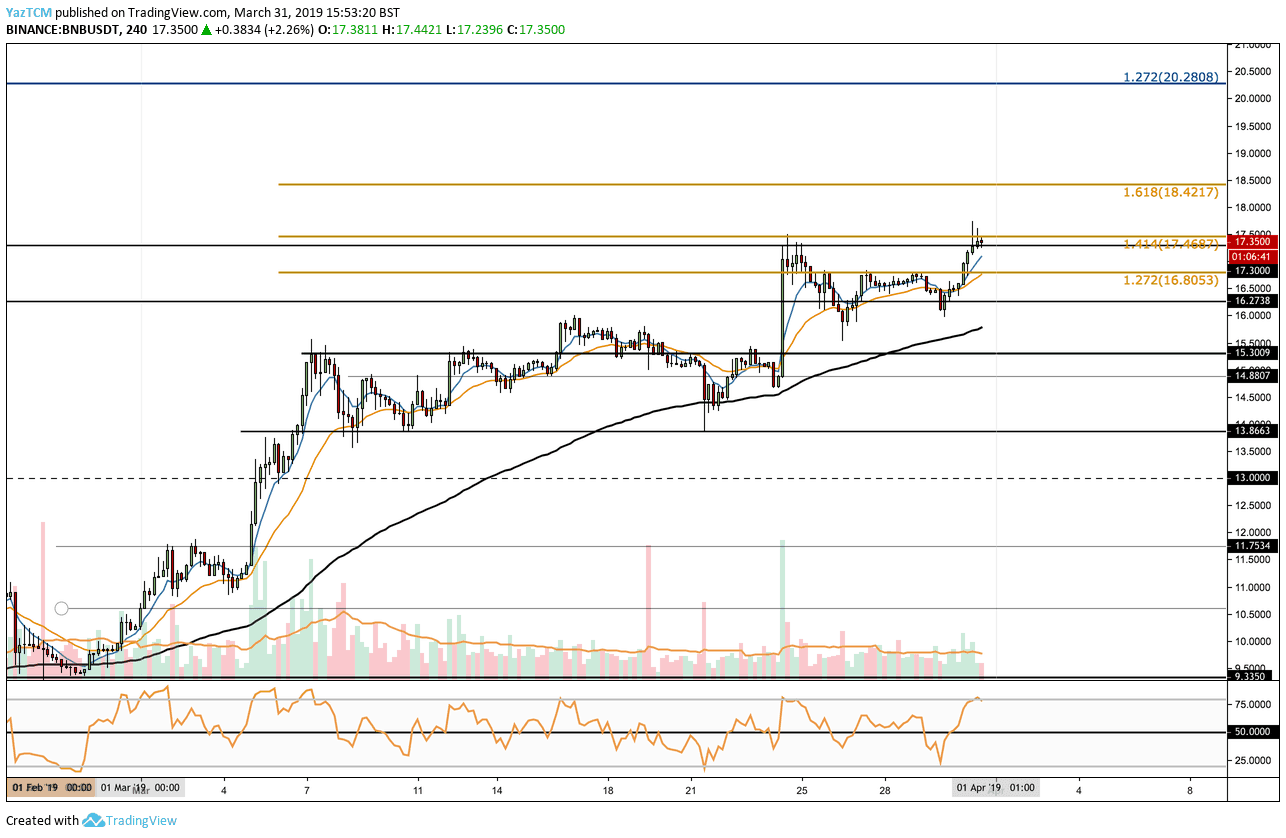
Looking at the BNB/USD 4-Hour Chart:
- Since our previous BNB analysis, we can see that the coin has continued to rise higher. The coin has broken above the previously mentioned resistance at $16.80 and has continued to break further resistance at $17.46, where lies the 1.414 Fibonacci Extension level.
- From above: If the bulls continue and break above $17.50, we can expect higher resistance retest above at the $18.00 area, $18.42 and $19, before reaching the $20 – $20.28 zone where lies the long term 1.272 Fibonacci Extension level.
- From below: Support lies at $16.80, $16.27. Further support lies at $15.30, $14.88 – $15 and $13.88.
- The 4-hour RSI has reached overbought conditions which may signal that the market needs some air, as a healthy correction, before continue higher.
- The trading volume is relatively high, following the strong month of March.
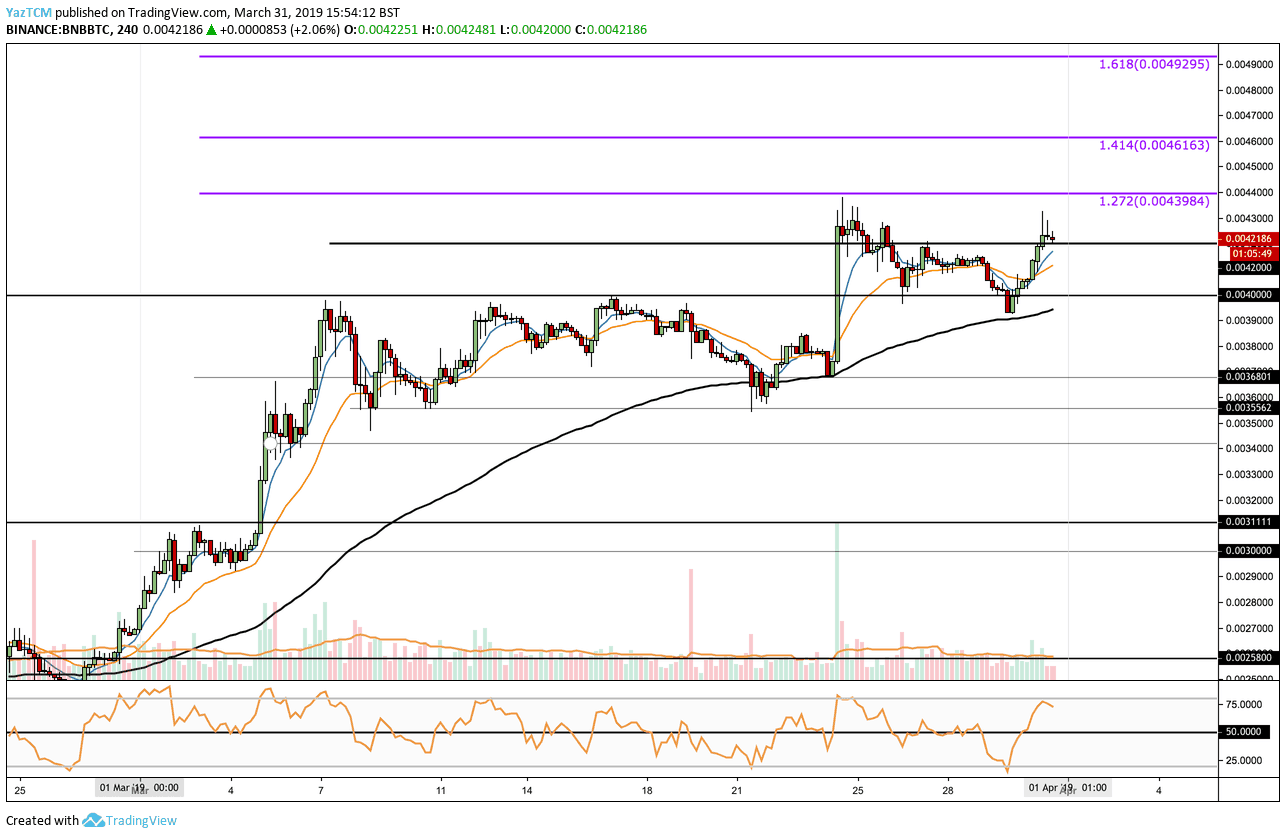
Looking at the BNB/BTC 4-Hour Chart:
- Following our previous analysis, we can see that coin has broken above the 0.0042 BTC resistance. The currency continued to climb, before getting rejected, reaching the next resistance level at 0.004398 BTC where lies the 1.272 Fibonacci Extension level.
- From above: The next resistance lies at 0.004398 BTC, further resistance lies at 0.004616 BTC along with the 1.414 Fibonacci Extension level, before reaching the 0.004929 BTC – 0.0050 BTC zone.
- From below: As mentioned, BNB is at its overbought area, we can expect a healthy correction. The closest support lies at 0.0040 BTC. Beneath this, support lies at 0.0038 BTC, 0.003680 BTC, and 0.0034 BTC.
- The 4-hour RSI has reached the overbought conditions which suggest that the market may go for a correction before continues up to break above 0.004398 BTC. There is also some divergence between price and the RSI which helps to confirm that the market may drop before being able to rise over the next few days.
- The trading volume has remained strong during March.
-
SPECIAL OFFER (Sponsored)
Binance Free $600 (CryptoPotato Exclusive): Use this link to register new account and receive $600 exclusive welcome offer on Binance (
full details).
LIMITED OFFER 2024 for CryptoPotato readers at Bybit: Use this link to register and open a $500 BTC-USDT position on Bybit Exchange for free!
Disclaimer: Information found on CryptoPotato is those of writers quoted. It does not represent the opinions of CryptoPotato on whether to buy, sell, or hold any investments. You are advised to conduct your own research before making any investment decisions. Use provided information at your own risk. See Disclaimer for more information.
Cryptocurrency charts by TradingView.