Binance has shown some signs of reversing the recent bearish trend following an impressive 12% price increase over the past 24 hours of trading, bringing the current BNB price up to $21.80.
Binance has just announced its next Binance Launchpad token sale, which will be Harmony Protocol.
Harmony is an innovative high-throughput, low-latency and low-fee consensus platform. Further details are expected to be announced on May 15 but the immidiate response was a 10% price increase for BNB.
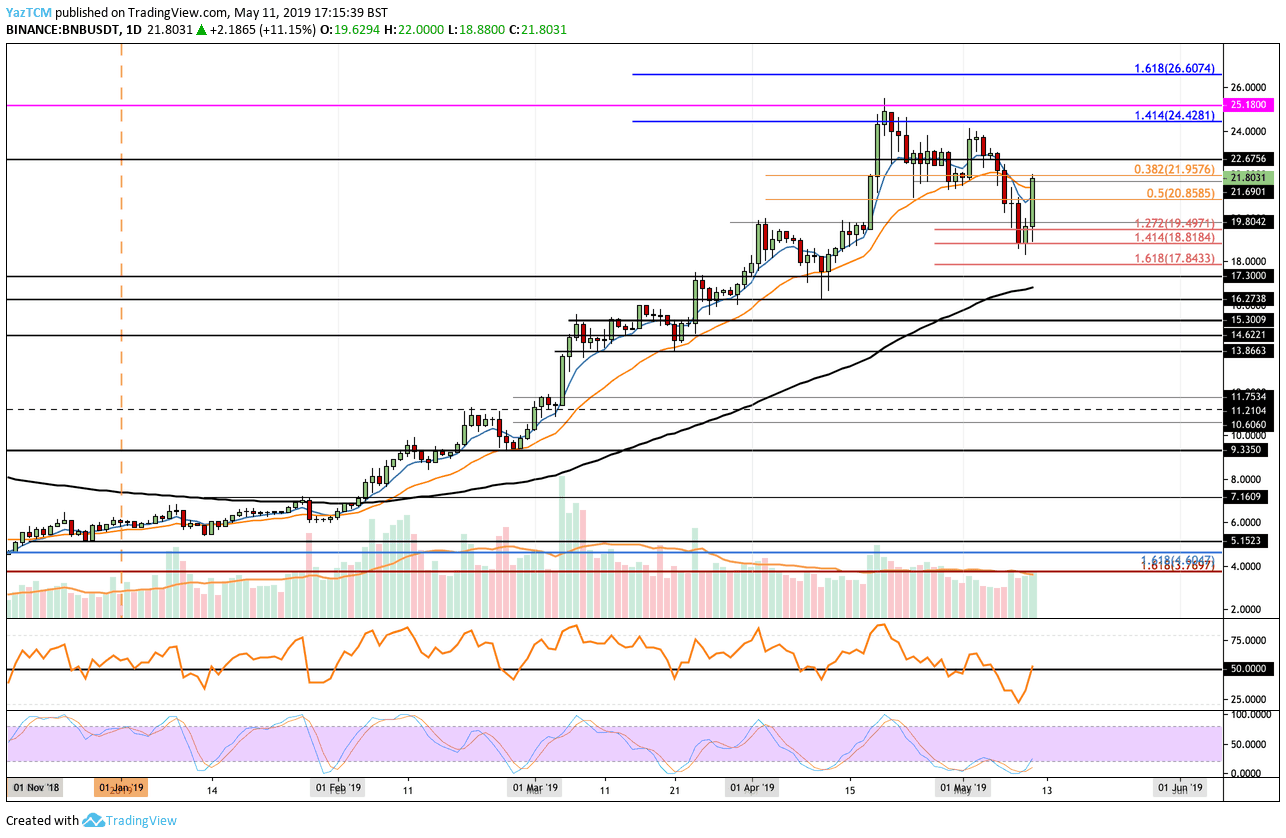
Looking at the BNB/USD 1-Day Chart:
- Since our last BNB/USD price analysis, we can see that BNB/USD continued to fall even lower until hitting our highlighted support at $18.81. The support at this level was provided by a short term downside 1.414 FIbonacci Extension level. The coin has rebounded upon reaching this level and has broken back above the $20 mark to where it is currently trading now.
- From above: The nearest level of resistance is now located at $22. Further resistance then lies at $24.40 and $25.18, which the previous ATH price. Above $25.18, higher resistance is located at $26 and $26.60.
- From below: The nearest level of support now lies at $20.85 and $20. Further support lies at $19.50 and $18.81. If the sellers break beneath the low of $18.81, the next support lies at $17.84 and then $16.30 which contains the 100 days moving average line.
- The trading volume has remained average over the past few days but is still high.
- The Stochastic RSI is in an extremely oversold area. A crossover above could trigger a positive correction.
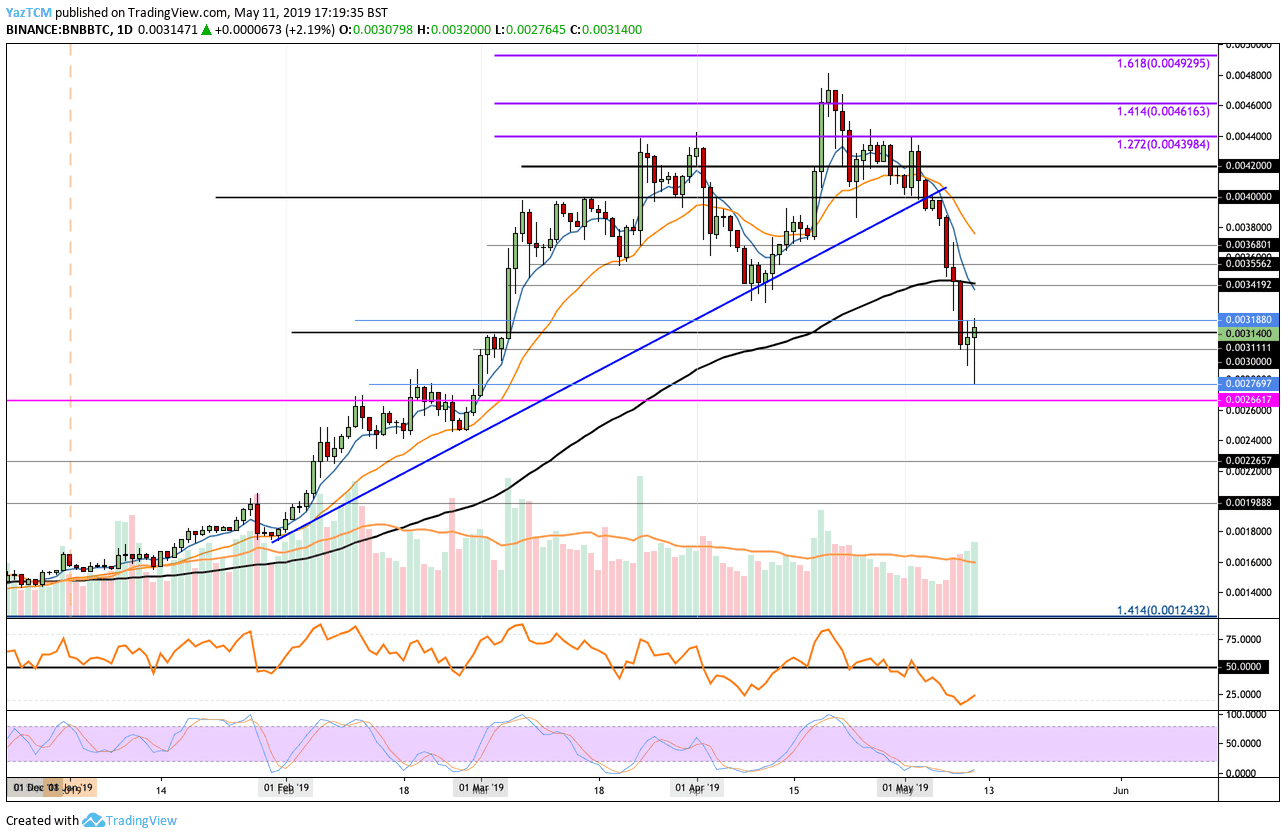
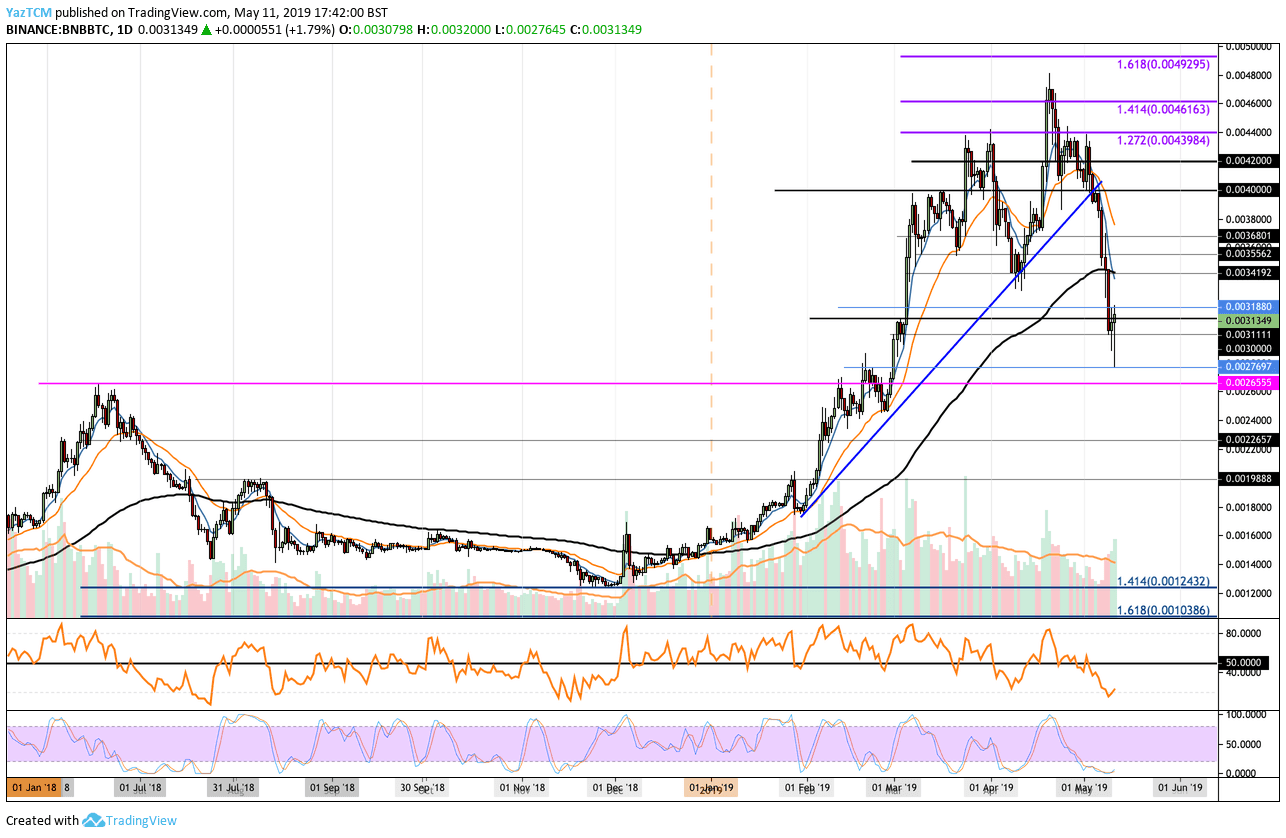
Looking at the BNB/BTC 1-Day Chart:
- Following our previous BNB/BTC analysis, we can see BNB has continued to depreciate against BTC and has fallen beneath the support of the 100 days moving average line. BNB/BTC continued further lower to the 0.0027 BTC support level.
- The last level had provided resistance for the market during February 2019 and is now acting as a strong support line.
- From above: Initial resistance lies at 0.00318 BTC and 0.003420 BTC which is further bolstered by the 100 days moving average line. Higher resistance above then lies at 0.0035 BTC and 0.00368 BTC levels. Further signficant resistance above 0.0038 BTC lies at 0.004 BTC and 0.0042 BTC.
- From below: Initial support now lies at 00.0031 BTC and 0.0030 BTC area. Beneath 0.003 BTC lies the 0.002769 BTC, 0.0027 BTC and 0.0026 BTC levels.
- The Stochastic RSI indicator is also primed to produce a crossover above signal in extremely oversold territory, which could suggest a bullish correction is approaching.
SPECIAL OFFER (Sponsored)
LIMITED OFFER 2024 for CryptoPotato readers at Bybit: Use this link to register and open a $500 BTC-USDT position on Bybit Exchange for free!
Disclaimer: Information found on CryptoPotato is those of writers quoted. It does not represent the opinions of CryptoPotato on whether to buy, sell, or hold any investments. You are advised to conduct your own research before making any investment decisions. Use provided information at your own risk. See Disclaimer for more information.
Cryptocurrency charts by TradingView.