Quick recap: Last Thursday saw another failed attempt to break the $10,000 mark. Shortly after, followed by the fatal drops of the global markets, Bitcoin found its value recording a daily low near $9K, almost $1000 intraday price move.
This is not what the Bitcoin bulls prayed for: Together with the drop, was the idea of the positive correlation between Bitcoin and the markets.
That correlation faded away over the past months, but as we could see, when heavy investors are selling off (Wall Street ended Thursday with 6-7% drops), it’s also coming to the cryptocurrencies. Gold, unlike Bitcoin, stayed stable during that period.
After the sell-off to $9K, we saw a correction of 1-2% in Wall Street’s Friday trading session. This correction was also reflected in Bitcoin’s value.
The price of BTC corrected 30-40% of the drop, and over the past 48 hours, Bitcoin is trading steadily around the $9400 mark, which is also the 38.2% Fibonacci retracement level.
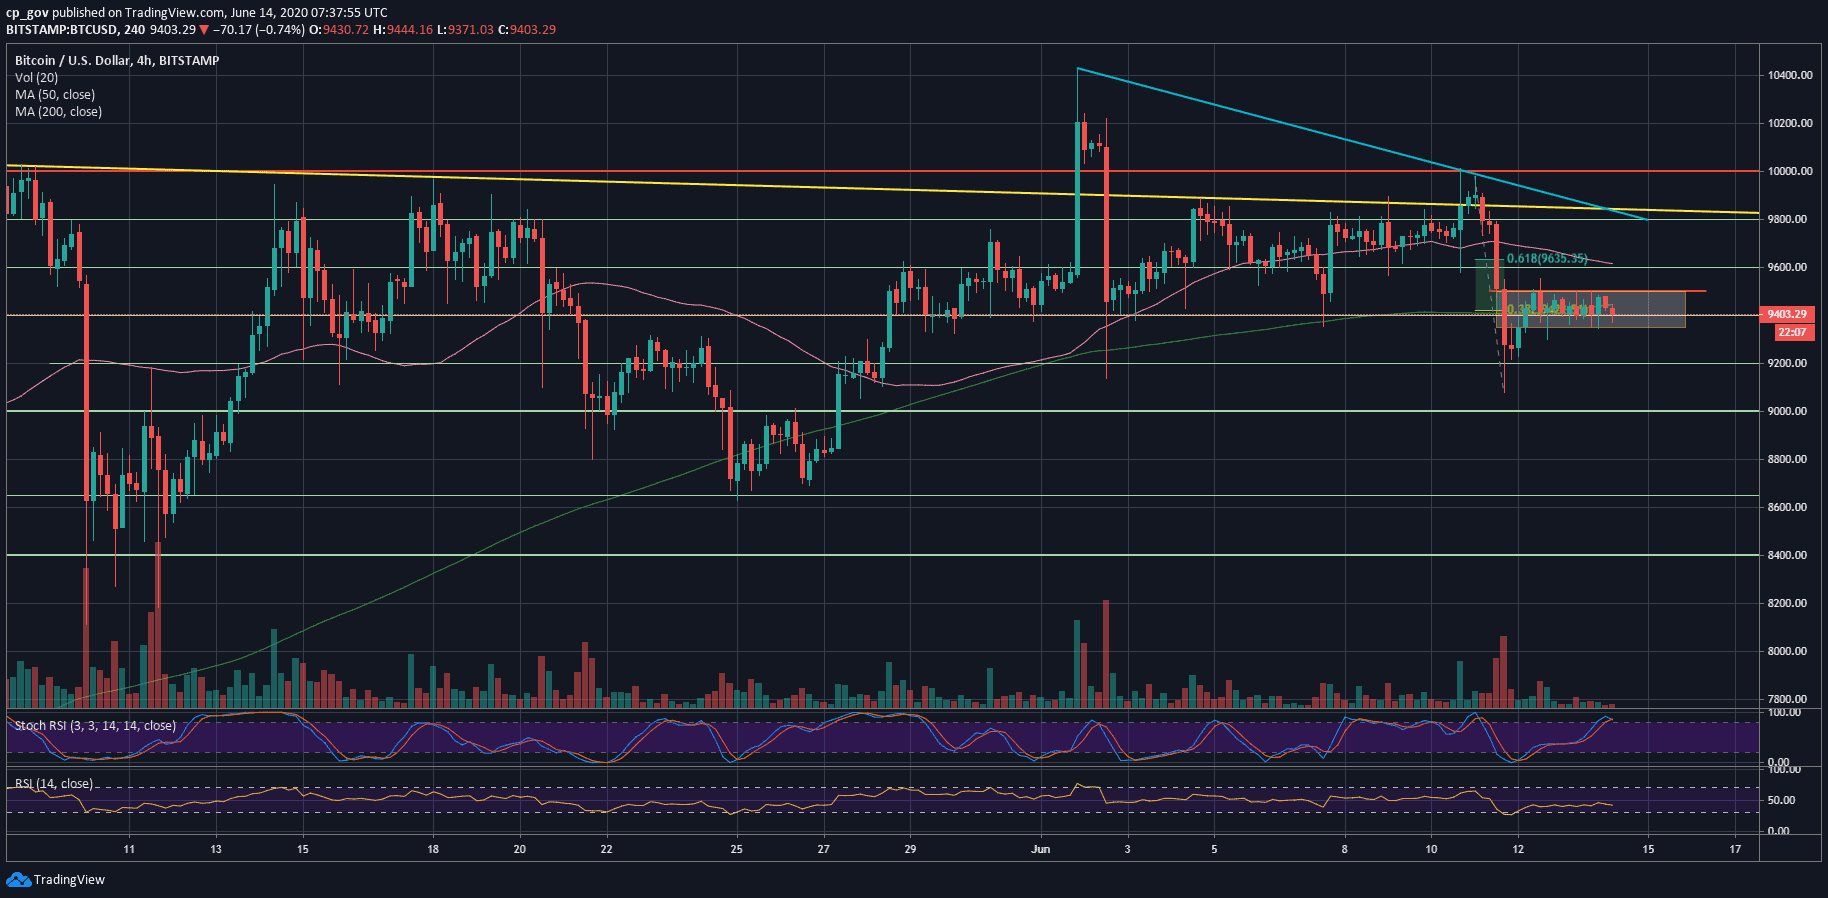
As can be seen on the following 4-hour chart, Bitcoin’s trading range is marked by a rectangle. The upper boundary lies around $9500, while the bottom lies at $9350.
A breakout to any direction is likely to point out the next short-term direction for Bitcoin.
From above, the first level of resistance above $9500 lies at $9650, followed by $9800, along with the marked descending trend-line on the following 4-hour chart.
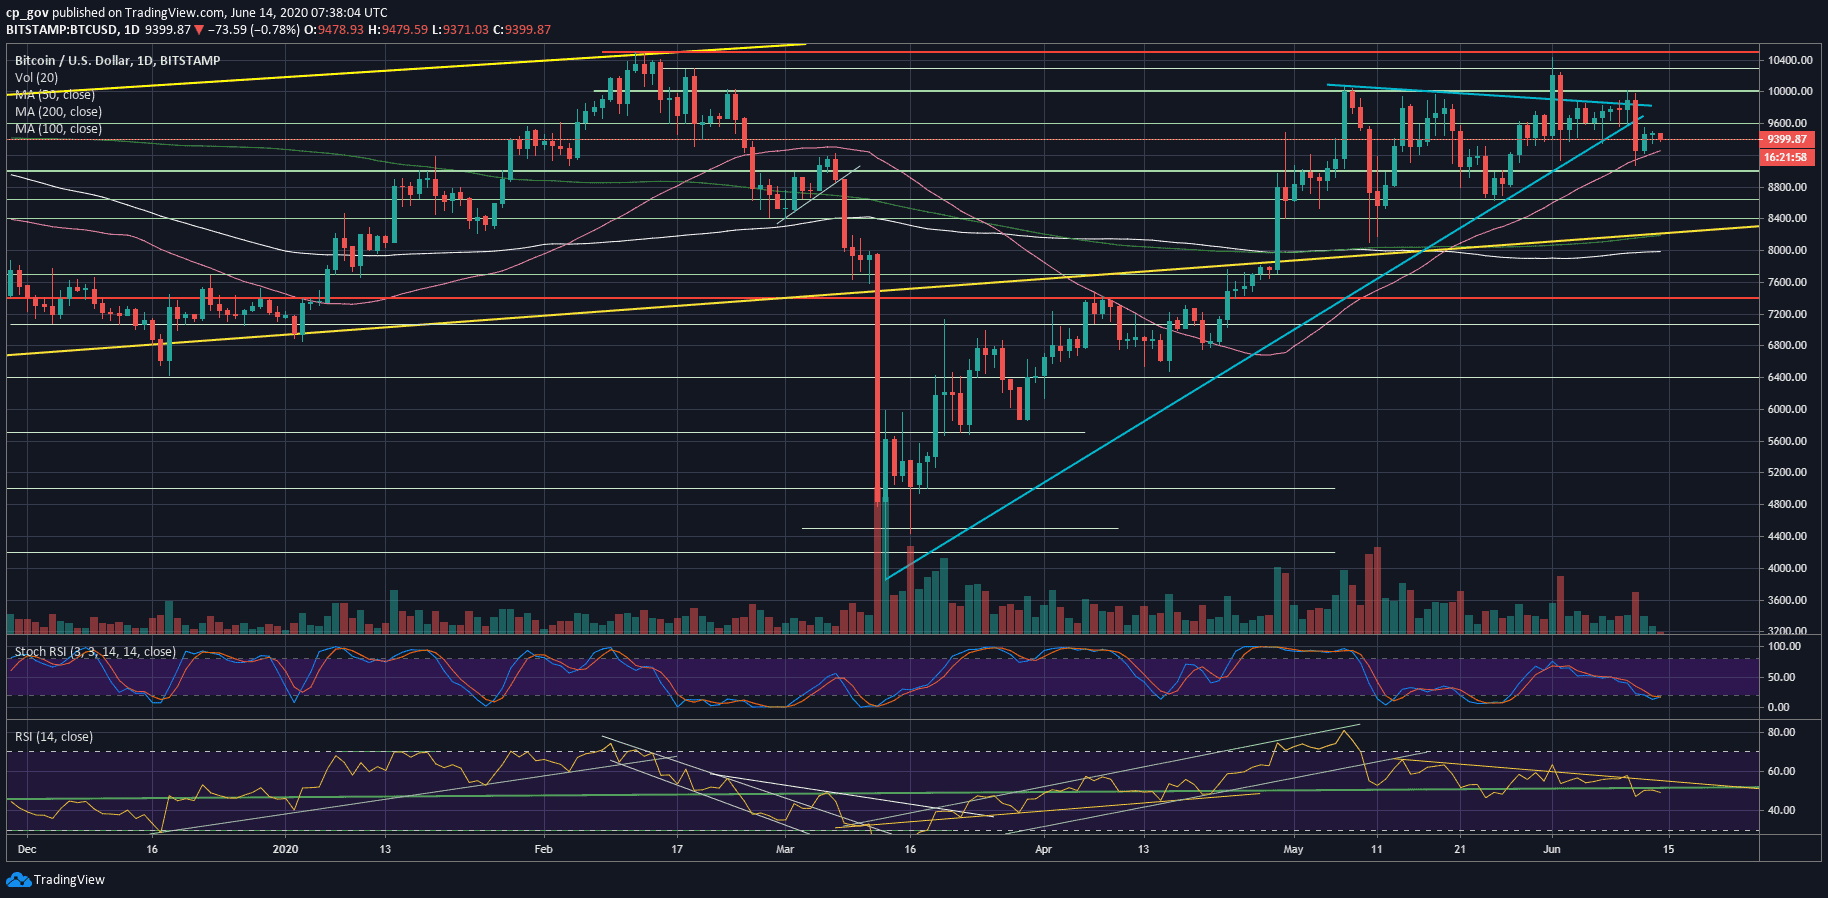
From below, beyond $9350 lies $9260, which is the 50-days moving average line (marked pink on the following daily chart), followed by the $9K area, which is the low-level from Thursday.
Sadly to say, it seems like Bitcoin will be waiting for the Wall Street futures, which are expected to start trading early afternoon on Sunday (U.S. time zone) and should point out if the Thursday storm was just a one-time event or it will continue to this week as well.
Judging by the extremely low levels of trading volume over Friday and Saturday, together with the indecisive stage of the RSI indicator (stuck around 50), we can conclude that Bitcoin is also waiting for its next big move.
Total Market Cap: $267 billion
Bitcoin Market Cap: $173 billion
BTC Dominance Index: 64.9%
*Data by CoinGecko