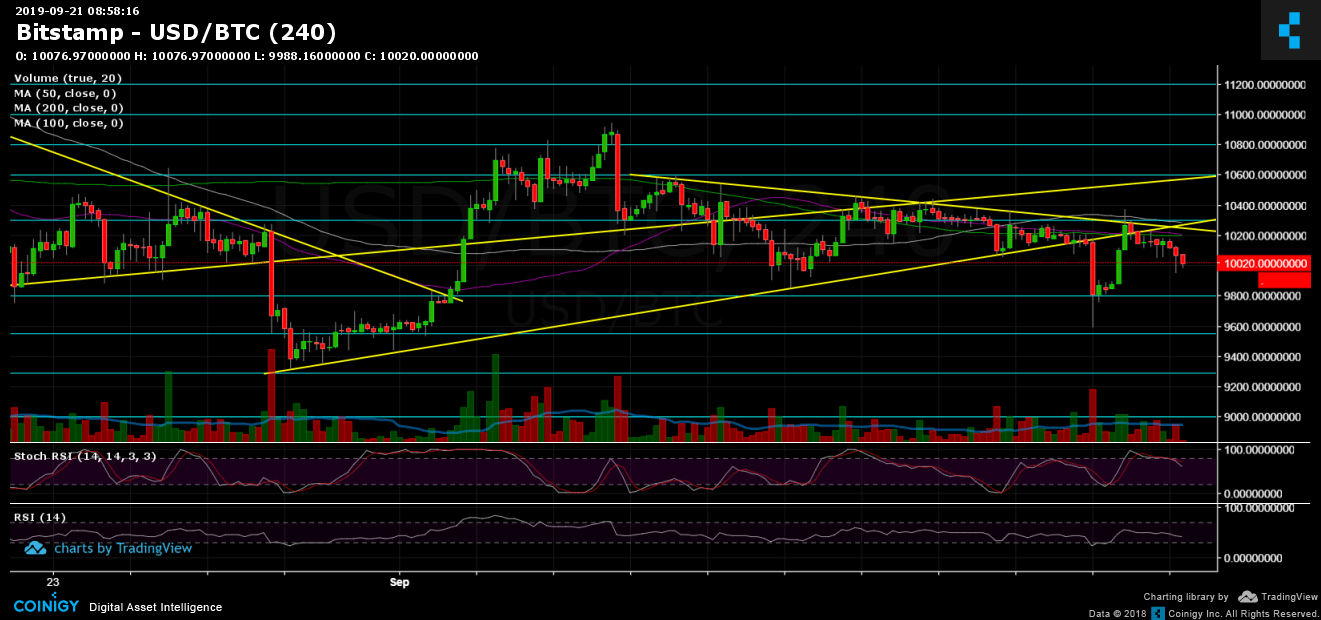
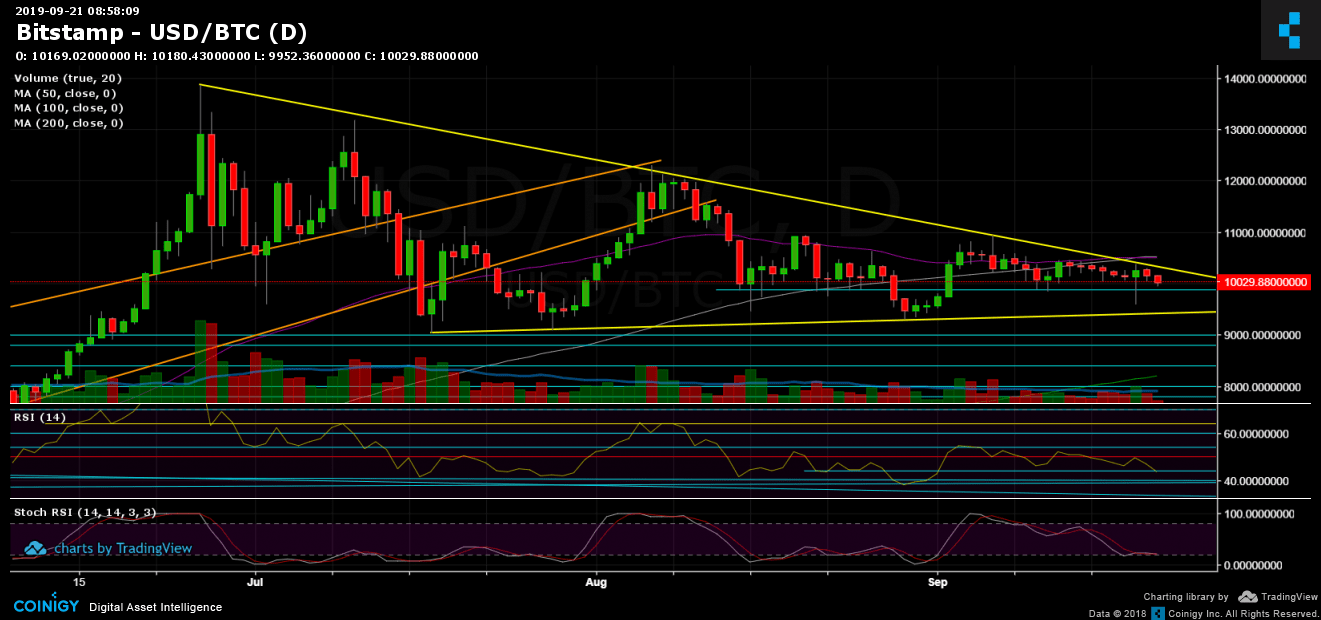
Three days ago, on our previous Bitcoin price analysis, we had identified the “short-term” triangle on the 4-hour chart. We had also stated that Bitcoin is likely to reach the low of the “bigger” triangle (marked on the daily chart) in case of a breakout to the downside.
As could be seen, Bitcoin had reached a low of $9,500 (BitMEX) following the breakdown of the 4-hour’s triangle formation around $10,160. An immediate plunge of more than $500.
Was this the end? The significant “bigger” triangle support held, and since then Bitcoin had seen an enormous surge back to the $10,300 zone, which is another retest of the upper angle of the 4-hour’s triangle. Since getting rejected, Bitcoin is slowly losing momentum, towards the $10,000 support region.
To sum it up – the short term is bearish, the longer term is dependent on the triangle formation – breaking above $10,500 (along with the significant 50 and 100 days moving average lines) or the bearish forecast which will take place when breaking down $9,400.
Bakkt Bitcoin futures launch date is September 23, this coming Monday. As we know from the short history of Bitcoin, the CME futures launch date initiated the colossal bear market of 2018. Will history repeat itself?
Total Market Cap: $268 billion
Bitcoin Market Cap: $181 billion
BTC Dominance Index: 67.6%
*Data by CoinGecko
– Support/Resistance:
As mentioned above, Bitcoin is about the support area of $10,000. The next major support lies at $9,800, then $9,600 and $9,450 (which is the bearish triangle boundary). A breakdown and it’s likely to see Bitcoin touching $9K or beyond.
From the bullish side, the 4-hour’s descending trend-line at around $10,200 is the first resistance line. The next is the confluence zone between $10,300 – $10,500, which also contains both the 50 and 100 days moving average lines (purple and white lines on the 1-day chart). Besides, another mid-term bearish sign could be coming from the current ‘fight’ between the two moving average lines. In case of a bearish cross (when the 50 days crosses below the 100 days).
– The RSI Indicator (Daily): The RSI is also bearish – we see lower highs, and the RSI is about to breakdown the 43-44 support. The stochastic RSI oscillator is around the oversold area, which might ignite a short-term correction before a further continues down.
– The Trading Volume: Last Thursday volume turned out to be the highest of the past two weeks. Despite that, the volume is decreasing over time, another sign of a coming-up strong move.