The past couple of months have been quite turbulent for Bitcoin’s price, which is as volatile as ever.
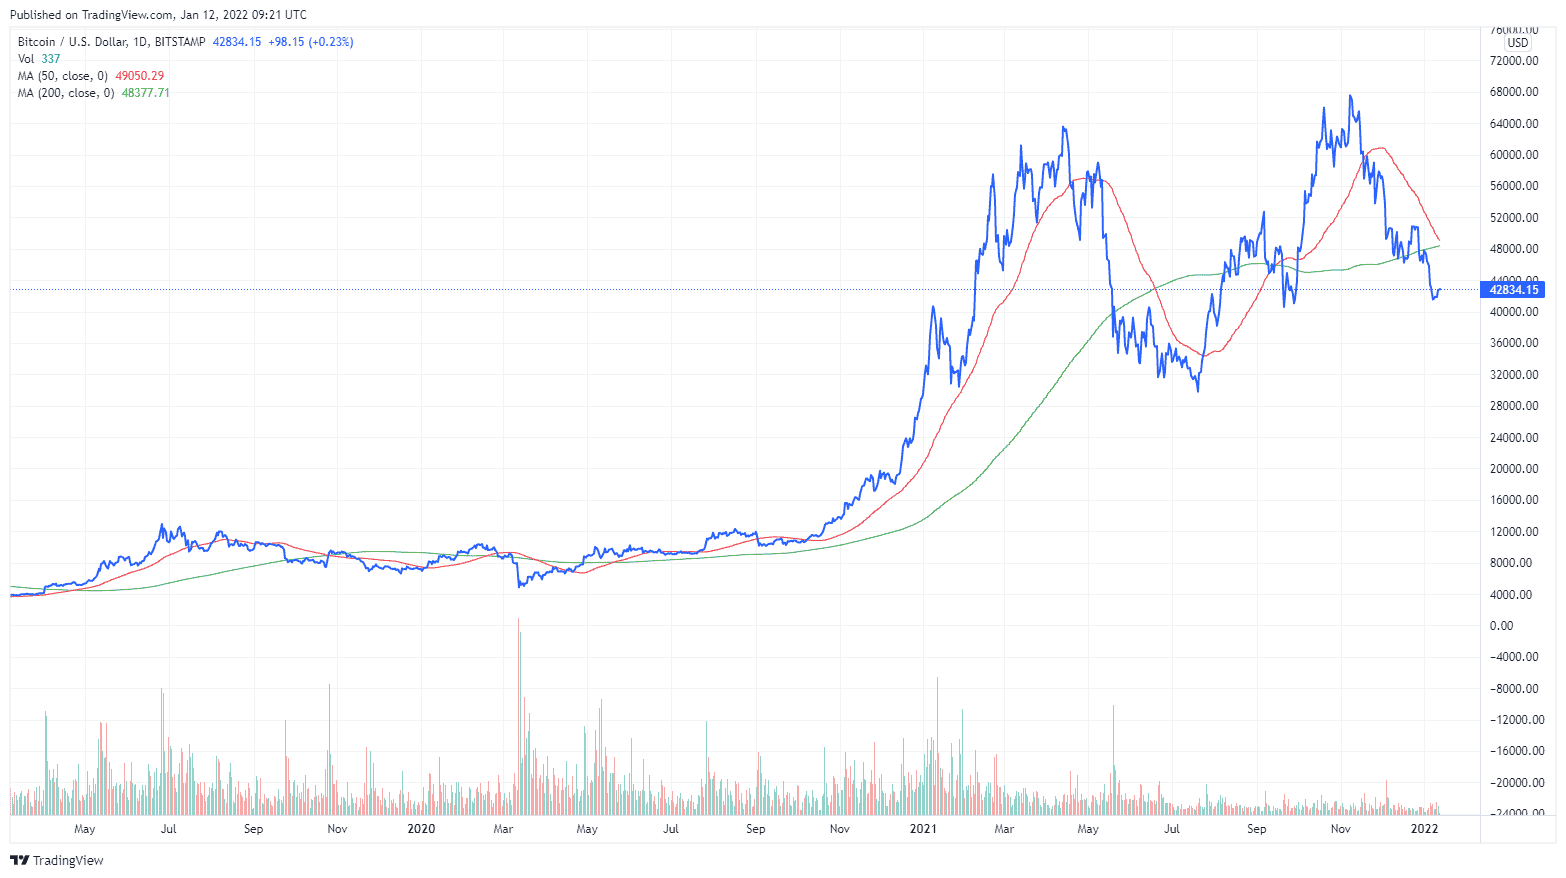
A little bit more than 60 days ago, BTC’s price reached its all-time high slightly below $70,000, and it’s now trading about 42% below that – at around $43K. This volatility has shifted the moving averages quite a bit in the interim, and two of the more important ones – the 50-day and the 200-day MAs are on the verge of completing a pattern known as the “Death Cross.”
A death cross is a technical analysis pattern indicating that two long-term moving averages are interacting in a way where the smaller one crosses below, the longer one. The most common indicators used for this are the 50-day and the 200-day moving averages.
At the time of this writing, the MA50 is on the verge of crossing below the MA200 and completing Bitcoin’s death cross, as seen in the chart below.
Traditional analysis tells us that the death cross “is a technical pattern indicating the potential for a major sell-off.” And that’s what a lot of people seem to think as well. However, here are a few reasons for which it might not be as bearish as you thought.
Right off the bat, we saw a tremendous increase in Bitcoin’s volatility over the past year. With this comes the formation of many patterns rather often, and the death cross is no exception.
As shown in the above chart, the pattern was formed on a few different occasions in 2021 alone.
In any case, it’s important to note that as the volatility of an asset increases, so does the formation of various patterns, which are oftentimes invalidated quicker than usual because of the turbulent market conditions.
The previous death cross took place in June when Bitcoin’s price was trading around $35,000. While the price subsequently dropped to slightly below $30K, by the time the death cross was formulated, the bulk of the summer correction was already completed.
The same can be said about other occasions from the not-so-distant past.
By definition, all patterns based on a moving average are lagging because they are based on a previously pre-defined period. However, the longer this period is, the more the indicators are lagging. In other words – it might be the case that most of the correction is through, given that BTC is already trading over 40% below its all-time high.
Another thing to consider is that markets price in all the information available. The death cross and its counterpart – the golden cross – are amongst the most popular patterns in technical analysis, and it’s virtually impossible for any investor to overlook them.
Everyone is aware that the death cross will take place, and chances are that people are placing their bets accordingly.
It’s worth noting, though, that history is never an indicator for future performance but it can give us an idea of how the market has reacted under similar technical circumstances in the past. Of course, it’s also important to look at fundamentals which, right now, are not looking as promising. This is evidenced by the turbulence on the traditional markets, which look less convincing under fears of increased rates throughout 2022.