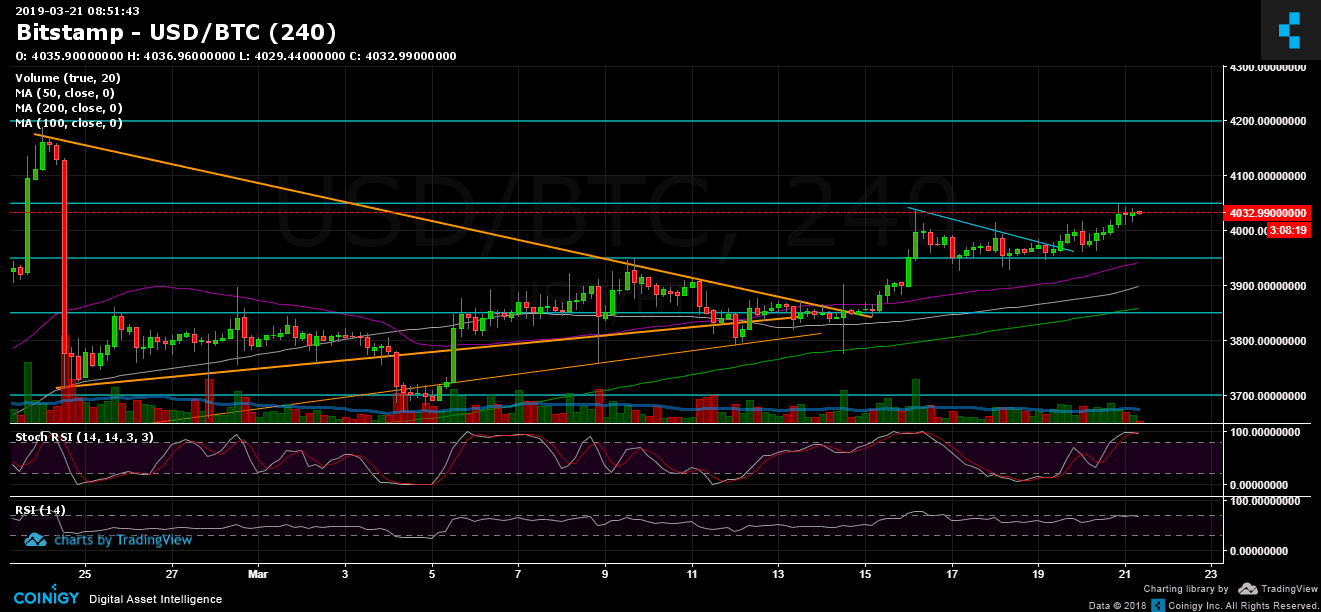
Since our recent price analysis, where we have mentioned the triangle that was forming on the 4-hour chart, we did receive a Bitcoin breakout. However, to the pessimistic surprise, BTC broke up the triangle formation.
The breakout granted the coin the immediate target of previous resistance at $4050. This resistance was tested recently, just three days ago, and over the recent hours, BTC is consolidating around that level.
So the question is whether or not Bitcoin can maintain its value above the $4K mark. However, the issue should be not the $4k, rather targeting the critical $4200 area. Despite getting closer to it, Bitcoin couldn’t overcome the $4200 resistance mark since December 3rd, 2018.
This will be the fourth time Bitcoin will be facing the critical level. The $4200 is the (first) real test above the $4K. A breakout and the bulls can see $5K closer than ever.
Total Market Cap: $141.7 Billion
BTC Dominance: 50.8%
– Support/Resistance: As mentioned above, Bitcoin is now facing the $4050 resistance mark. A break-up and the next target will be the $4100 resistance, before the critical level of $4200. Further above are the $4400 and $4500 levels before the daily chart’s 200-days moving average line (marked in light green), which as of now hovering lies around $4750.
From below, the closest support is the resistance-turned-support area at $3930 – $3950, beneath are the $3850 and $3800 support levels, before reaching the $3700 zone which includes the 50 and 100 days moving average lines (on the daily chart).
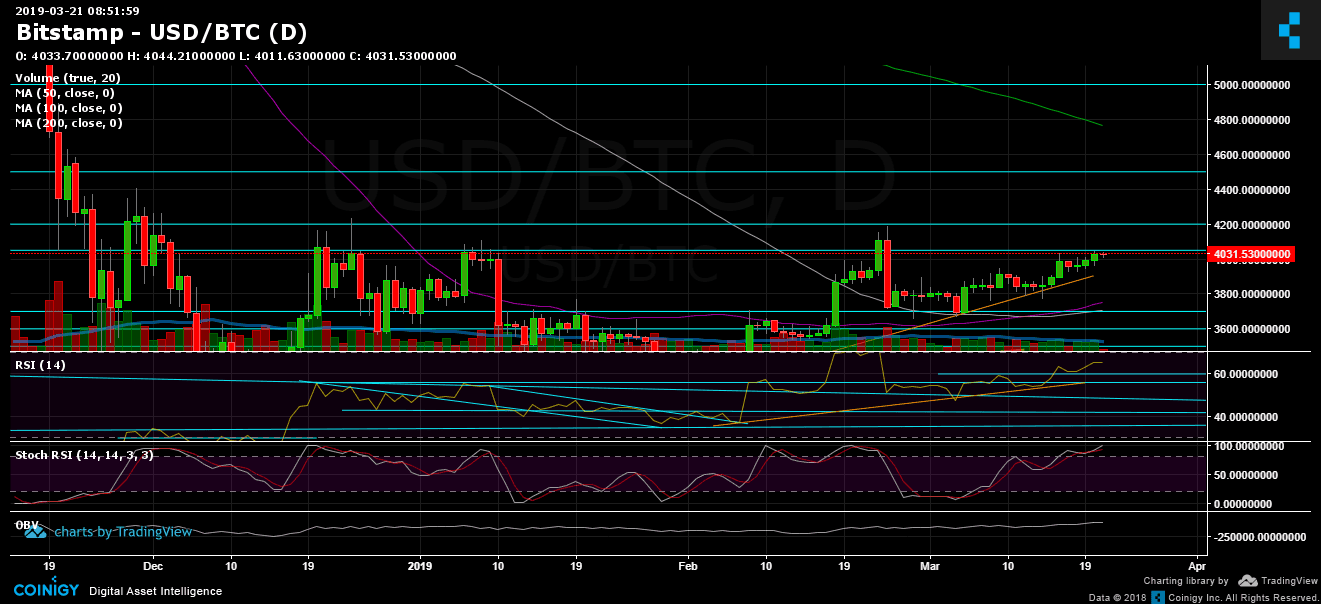
– The daily chart’s RSI level: Following our previous BTC analysis, the 60 RSI level had supported the Bitcoin’s daily chart. As of now, the RSI seems strong around the bullish territories. Even though a correction should be reached sooner or later, this is healthy.
– The daily trading volume: We’ve pointed out that the green volume candles are much higher than the red ones, something that could tell on accumulation. However, we do need to see much more volume that will prove that the buyers are back.
– BitFinex open short positions: The short positions have decreased to 21.5K BTC open positions.