Momentum is changing so quickly in the crypto markets. If four days ago everyone saw Bitcoin price getting below the $9,000 level for the first time since June, now the bulls are back.
As mentioned here on our previous analysis, Bitcoin had shown odd calmness, and we anticipated a coming-up huge move. However, no one here can predict the future, so we suggested reasons for both directions. As you could notice, Bitcoin chose the bullish side, and is completing 4 decent consecutive green candles on the daily, following 7% gains just today.
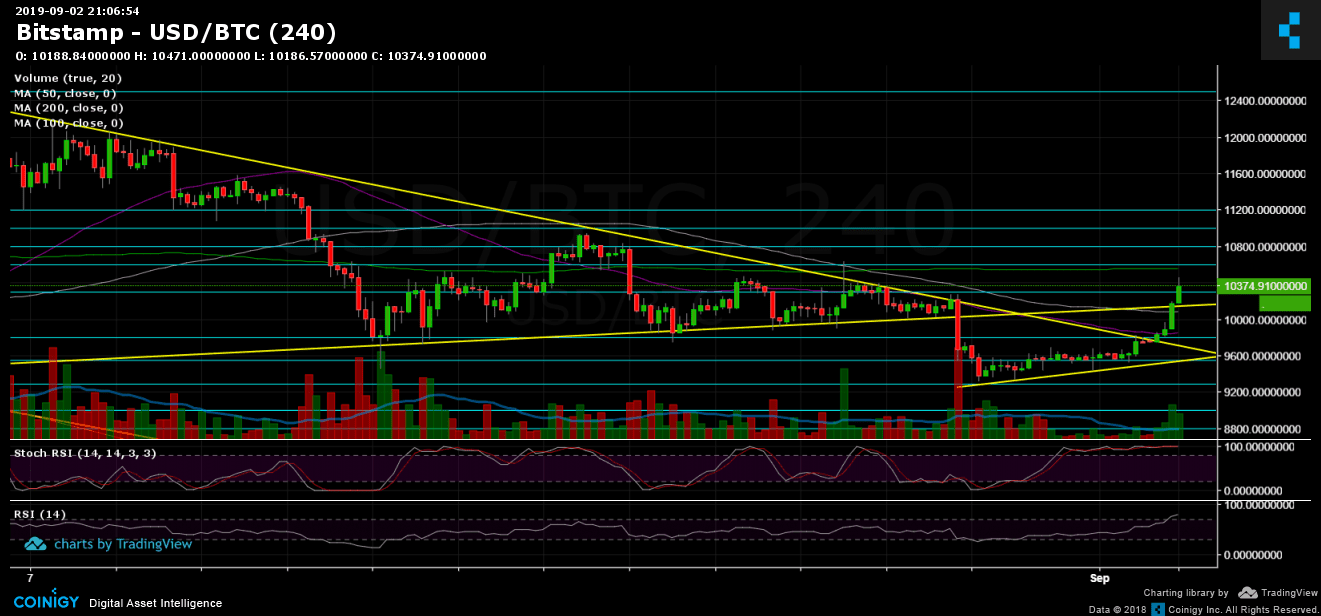
Being said that, we mentioned the target for the immediate bullish move – around $10,300 – $10,500. As of writing this, Bitcoin had recorded a daily high at $10,471 (Bitstamp) and found difficulties getting over it, as of now.
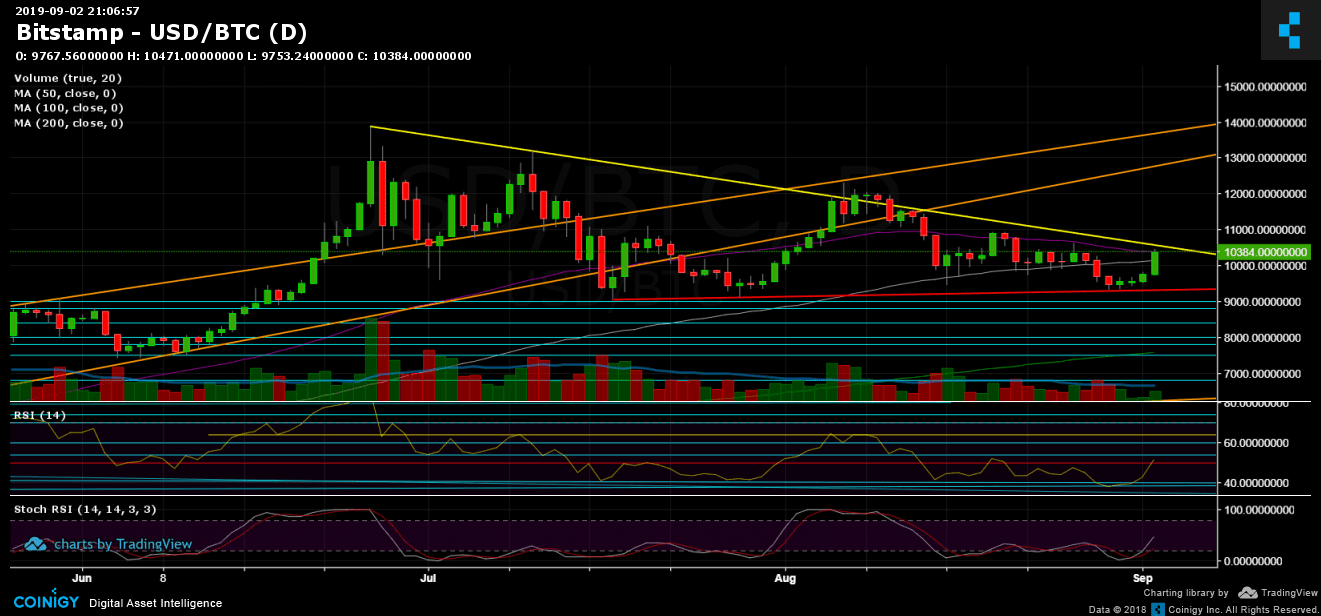
We can expect the mentioned level of $10,300 – $10,500 to be a tough one, mostly because the significant 50-days moving average line (marked purple on the following 1-day chart), along with the descending yellow trend-line, which started forming when Bitcoin recorded its 2019 high at $13,880. The two create a very strong resistance area. And after a massive surge, we can expect a little relief.
Total Market Cap: $264 billion
Bitcoin Market Cap: $185 billion
BTC Dominance Index: 70%
*Data by CoinGecko
– Support/Resistance:
As mentioned above, current levels of $10,300 – $10,500 have a lot of resistance. In case that this zone gets broken above, we would expect the next target to be $10,800 before reaching $11,000. $11K is also the previous high on the daily chart; thus, critical for Bitcoin to create a higher high above the $11K.
From below, resistance turned support levels at $10,000 – $10,100 (100-days moving average line), $9700 – $9,800 before reaching the weekly low areas at $9,400 – $9,500.
– Daily chart’s RSI: After recording its lowest since February, the RSI indicator surged along with the price. However, as of writing this, the indicator had encountered tough resistance of the 50 levels.
The Stochastic RSI oscillator signaled one more time this bullish move, after going through a crossover in the oversold territory and entering the bullish zone.
– Trading Volume: Despite the nice gains, the volume hadn’t been showing up yet. If the bulls want to prove they are back, they would need to bring up a higher amount of buyers.