Bitcoin as a commodity
As you probably know, technical analysis is not always right, but it’s correct most of the time. Three days ago while Bitcoin was trading around $10,600, our last analysis title suggested another re-test of the $10,000 level, when everyone was bullish, we saw this leg down coming-up.
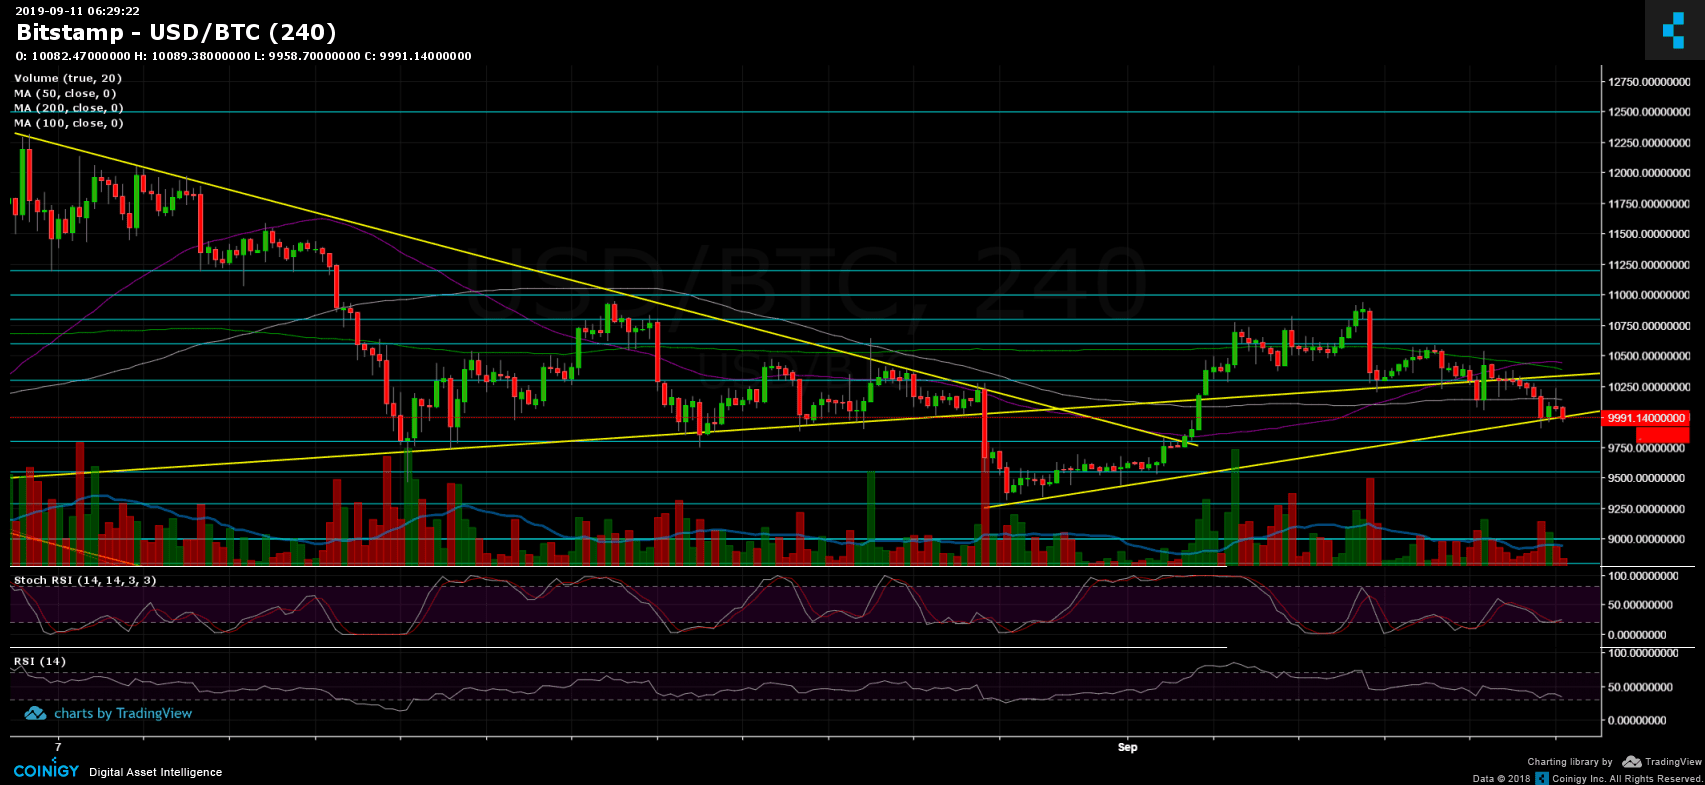
As you could notice, after getting rejected one more time by the crucial long-term descending yellow trend-line, started forming from the 2019 high at $13,880, Bitcoin plunged passed $10,000, marking the $9,880 support as its current daily low (as of writing this). This support is clearly seen on the following 4-hour ascending trend-line (marked yellow).
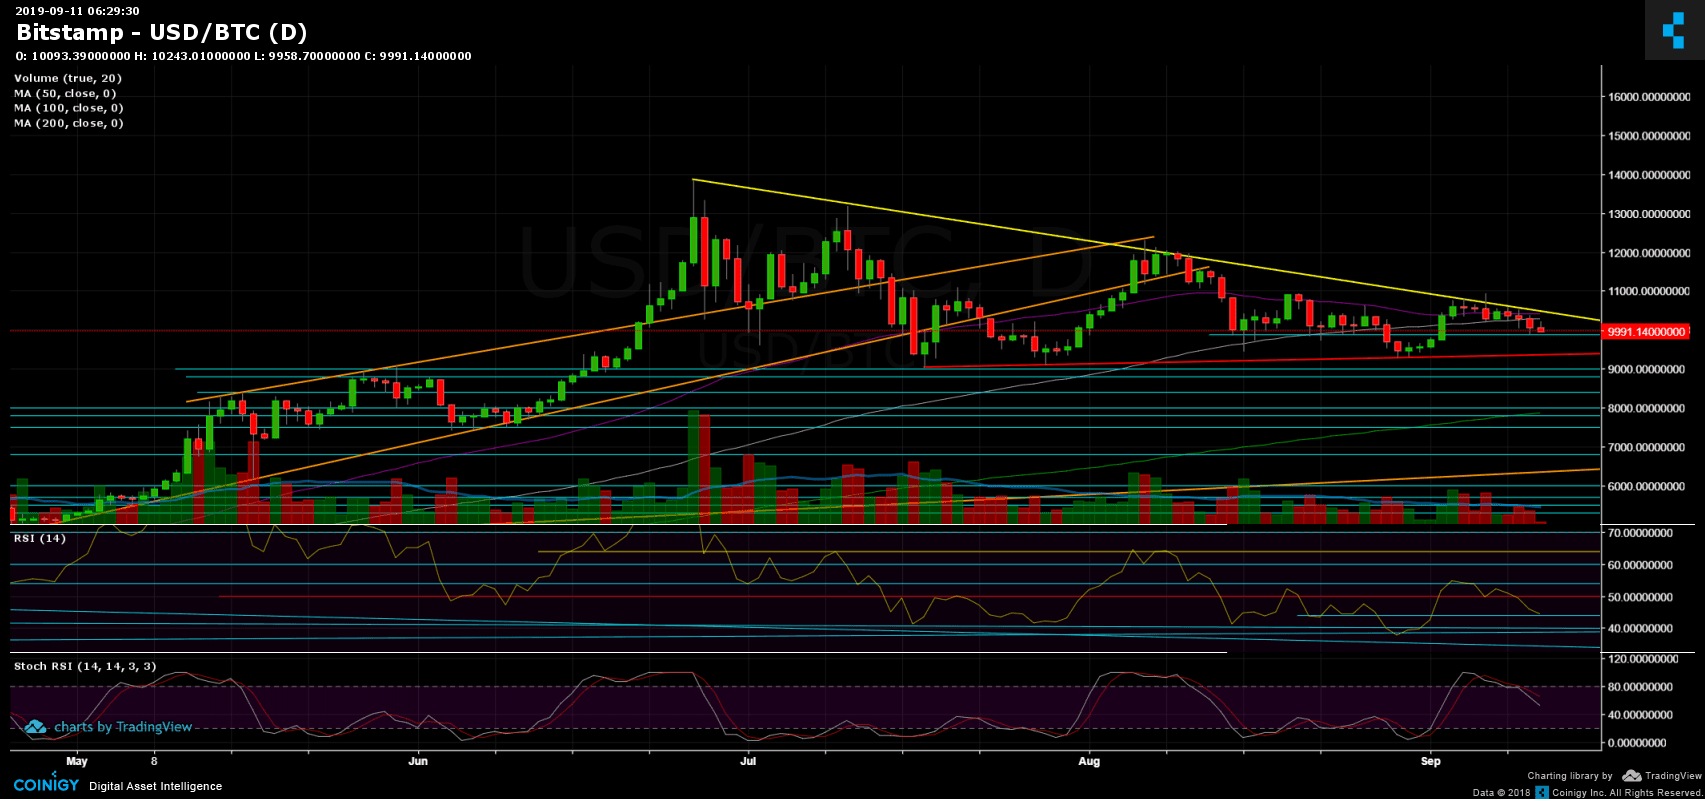
Looking at the bigger picture, the mentioned pattern of a substantial bearish triangle formation is still threatening the BTC chart. Of course, this can be invalidated at any moment; however, Bitcoin would need to break to the bullish side for it to take place and invalidate.
Simply put, the bigger picture from below is the crucial support line around $9,400, which is the last barrier before the triangle breaks to the downside. From the top, the triangles’ trend-line sits around the resistance level of $10,300 – $10,400. Hence, there is also a possibility of another leg up to the area mentioned above, before another final plunge.
Total Market Cap: $259 billion
Bitcoin Market Cap: $180 billion
BTC Dominance Index: 69.6%
*Data by CoinGecko
– Support/Resistance:
Bitcoin is now testing the critical $10,000 level as support. Nearby is the $9,880 support along with the 4-hour’s chart ascending trend-line. Further below lies $9600 (weak support level), before the crucial $9,400 level (the red ascending trend-line, the bottom line of the triangle). If broken down, Bitcoin is likely to produce a quick move down to $8,800 – $9,000 at first.
From the bullish side, the nearest level of resistance is the 100-days moving average line (marked white on the daily chart), around $10,250. Further above is the triangle’s descending line along with the 50-days moving average line (marked purple) at around $10,300 – $10,400. Above is the $10,500 – $10,600 zone.
– Daily chart’s RSI: After yesterday’s decline, the RSI is also standing on a decision point – the 44 levels. Overall, the RSI indicator tells the same bearish story of the Bitcoin’s price. Besides, since the stochastic RSI did make the mentioned cross-over at the overbought territory, Bitcoin lost almost $1,000 from its value.
– Trading Volume: Surprisingly, not a huge amount of volume followed the last move. Adding to the above, the daily volume is decreasing over time; this might tell on a coming-up huge price move.