After Bitcoin price recorded an all-time high last Friday at $42K, the primary cryptocurrency finally went down for the anticipated correction following the enormous 3-month rally.
BTC price soared from $10,500 to $42,000 without going through any significant correction. During the previous parabolic bull-run of 2017, there were several corrections of 30% on average.
The correction, which started on Sunday, saw a two-day plunge starting from the $41K level down to $30K at its lowest. Yesterday, the bulls tried to get control; however, most of the crypto Twitter community insisted that the correction is not over yet, and Bitcoin will likely retest below $30K.
But, Bitcoin has its own plans. As of writing these lines, the primary cryptocurrency had seen a $5K price increase only today, surpassing the significant resistance at $36,600 (with a side comment the 4-hour candle has two more hours to go as of writing these lines).
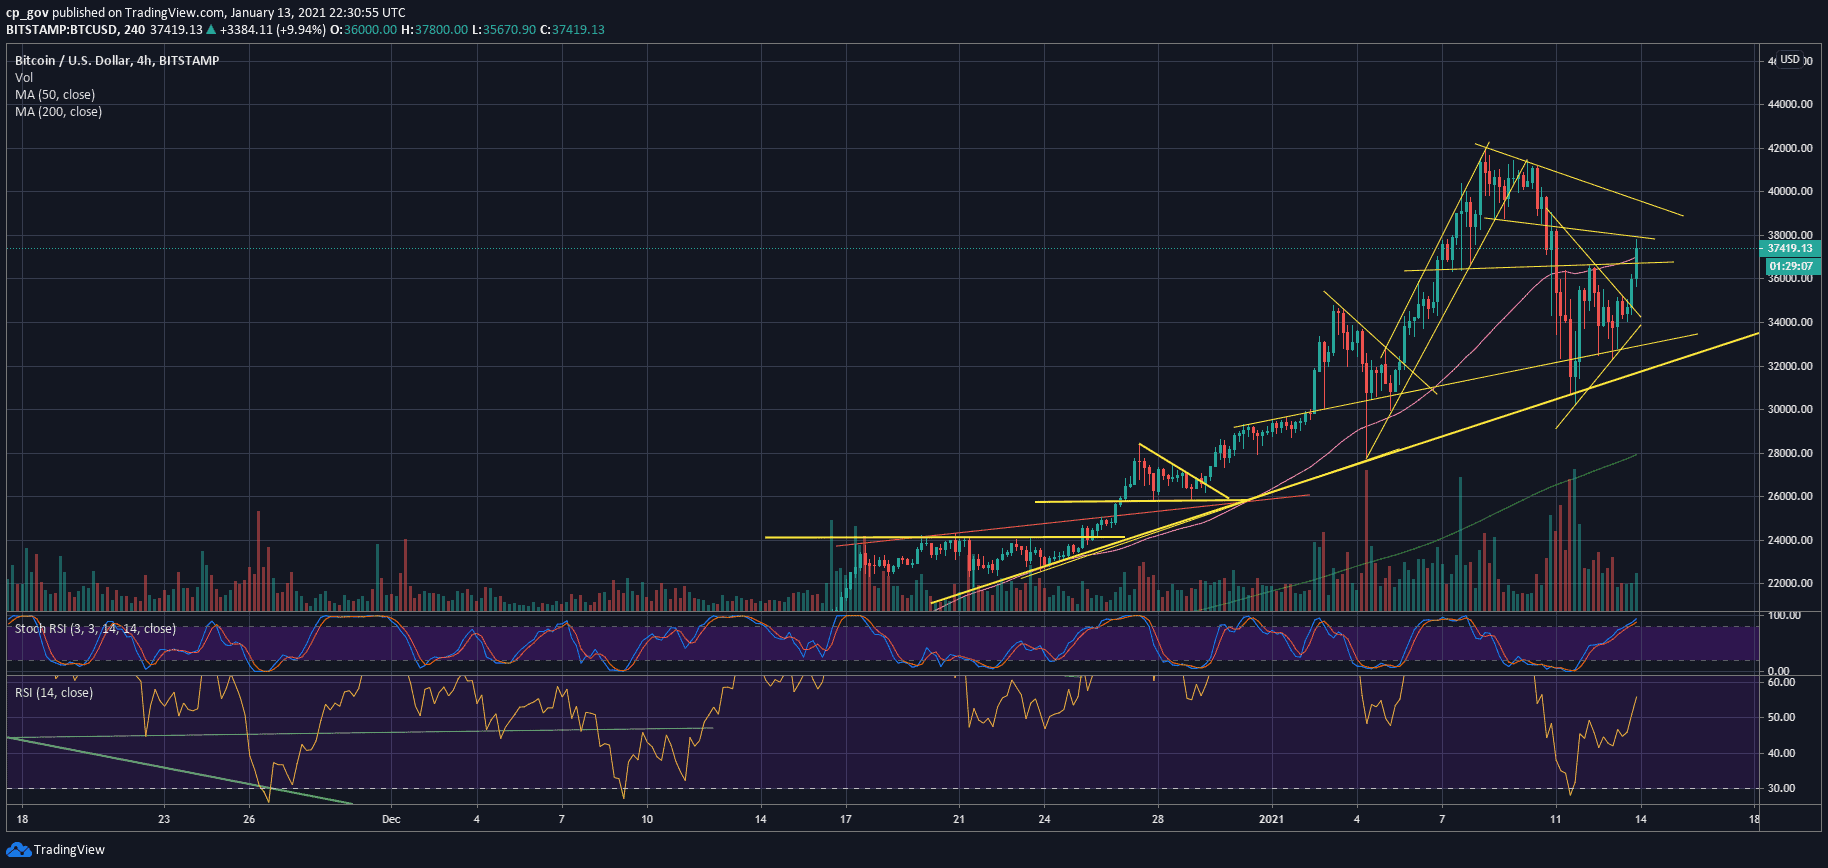
As can be seen on the following 4-hour chart, after breaking up from the marked symmetrical triangle at $34,400, the missile had launched as the cryptocurrency surged another $3K over the past hours.
Is Bitcoin aiming for a new all-time high in the next coming days? This scenario is very realistic. In order to stay short-term bullish, BTC will have to close today’s candle above the horizontal resistance of $36K – $36,600, along with the 4-hour MA-50 (the pink line on the following chart).
Looking ahead, the first level of resistance is the descending trend-line at $37,800, followed by the upper descending trend-line at around $39,000.
Further above lies $40,000, $41,200 (last weekend’s high), and the all-time high level at $42K.
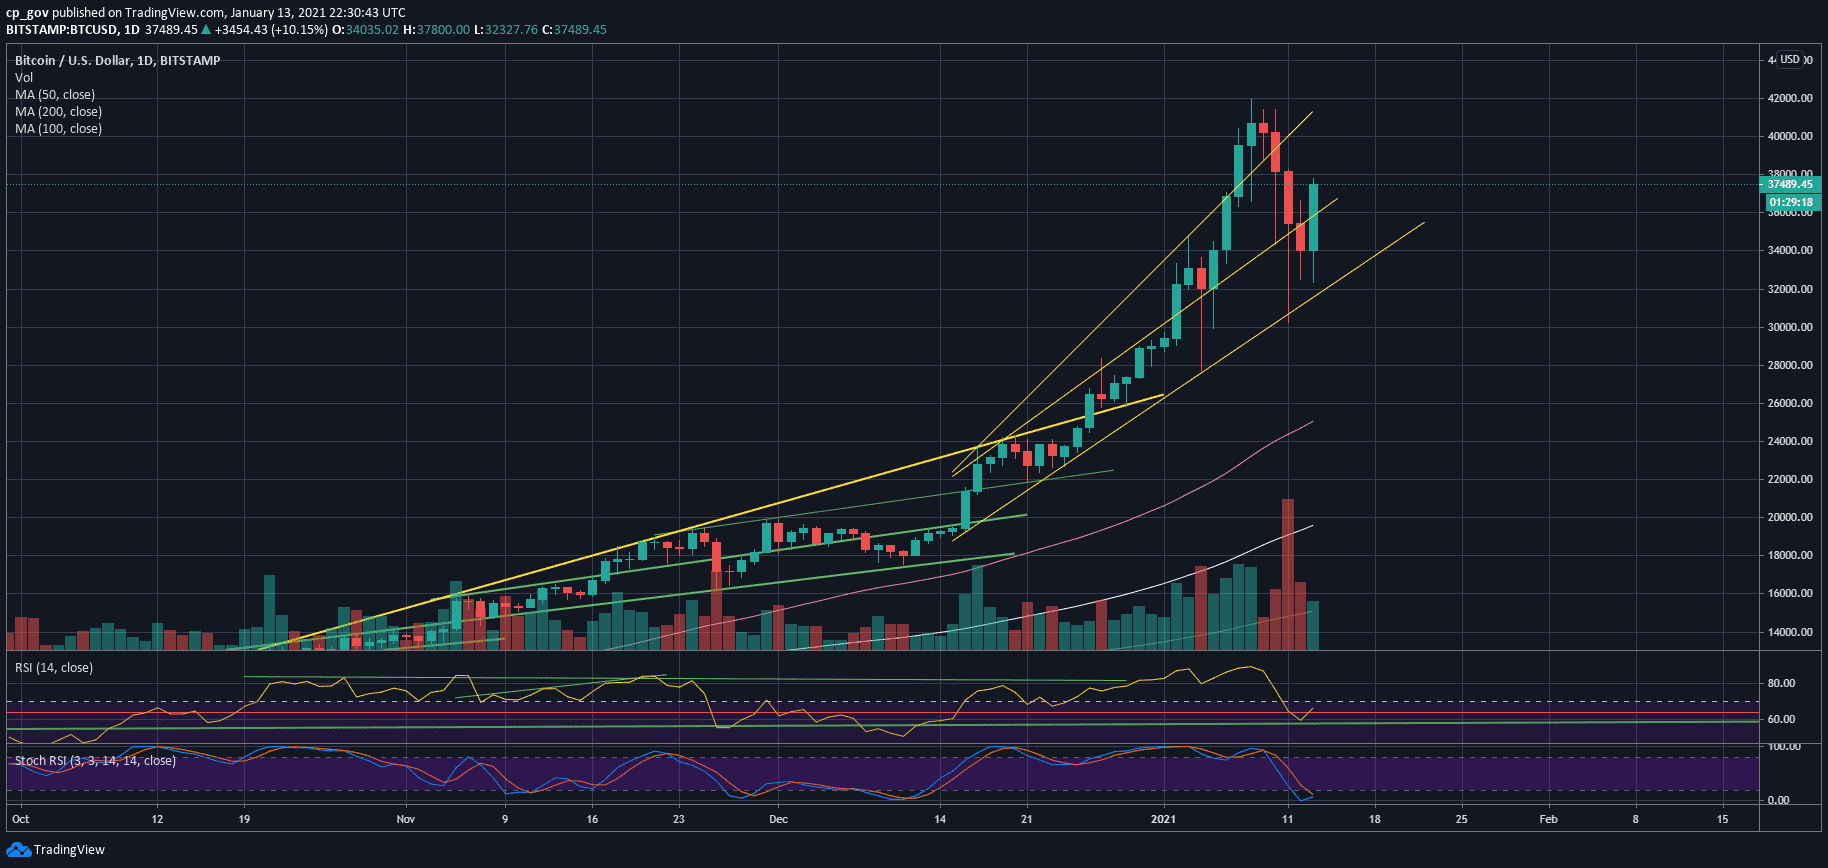
In case of a correction, the first level of support now lies at the $36,600 area, followed by the middle ascending trend-line as marked on the following daily chart (around $36K), $35,200, and $34,000.
From a technical point of view, the RSI looks promising in favor of the bulls, as the daily RSI is at the bullish territory above 50 (after reversing earlier today). At the same time, the Stochastic RSI oscillator is about to make a bullish crossover at the oversold area. In case this happens, it might assist the market in reaching higher highs.