Bitcoin doesn’t want to calm down. Just two days ago the coin was trading for $8100, and during the past hours, BTC was ready to set a new 2019 high, almost touching the resistance level at $9400.
If you had to put up a survey during late December 2018, when Bitcoin was hovering around $3500, you would find almost no one saying that 2019 will be bullish for Bitcoin. However, crypto is always unexpected.
The numbers show that Bitcoin completes a 200%+ move since 2019 begun as well as a weekly move of 24%.
Where can it go from here? There’s bullishness surrounding the coin, probably due to the hype of the coming up Facebook coin, along with Binance closing its gates to US traders (which probably caused many to hedge their altcoins into Bitcoin).
The last can be seen by looking at the following data. Yesterday the market cap was $273, with Bitcoin $154.4 of it (56.3% dominance). Today, $13 Billion was added to the market cap, but Bitcoin is responsible for most of the addition as it adds $10 Billion. The Altcoins, in response, are tumbling against Bitcoin and rising a lot less in their USD value.
Last thing, weekends are so far so good for Bitcoin during the past months. We had recently explained why this happens in detail.
Total Market Cap: $286 Billion
Bitcoin Market Cap: $164.4 Billion
BTC Dominance: 57.3%
– Support/Resistance:
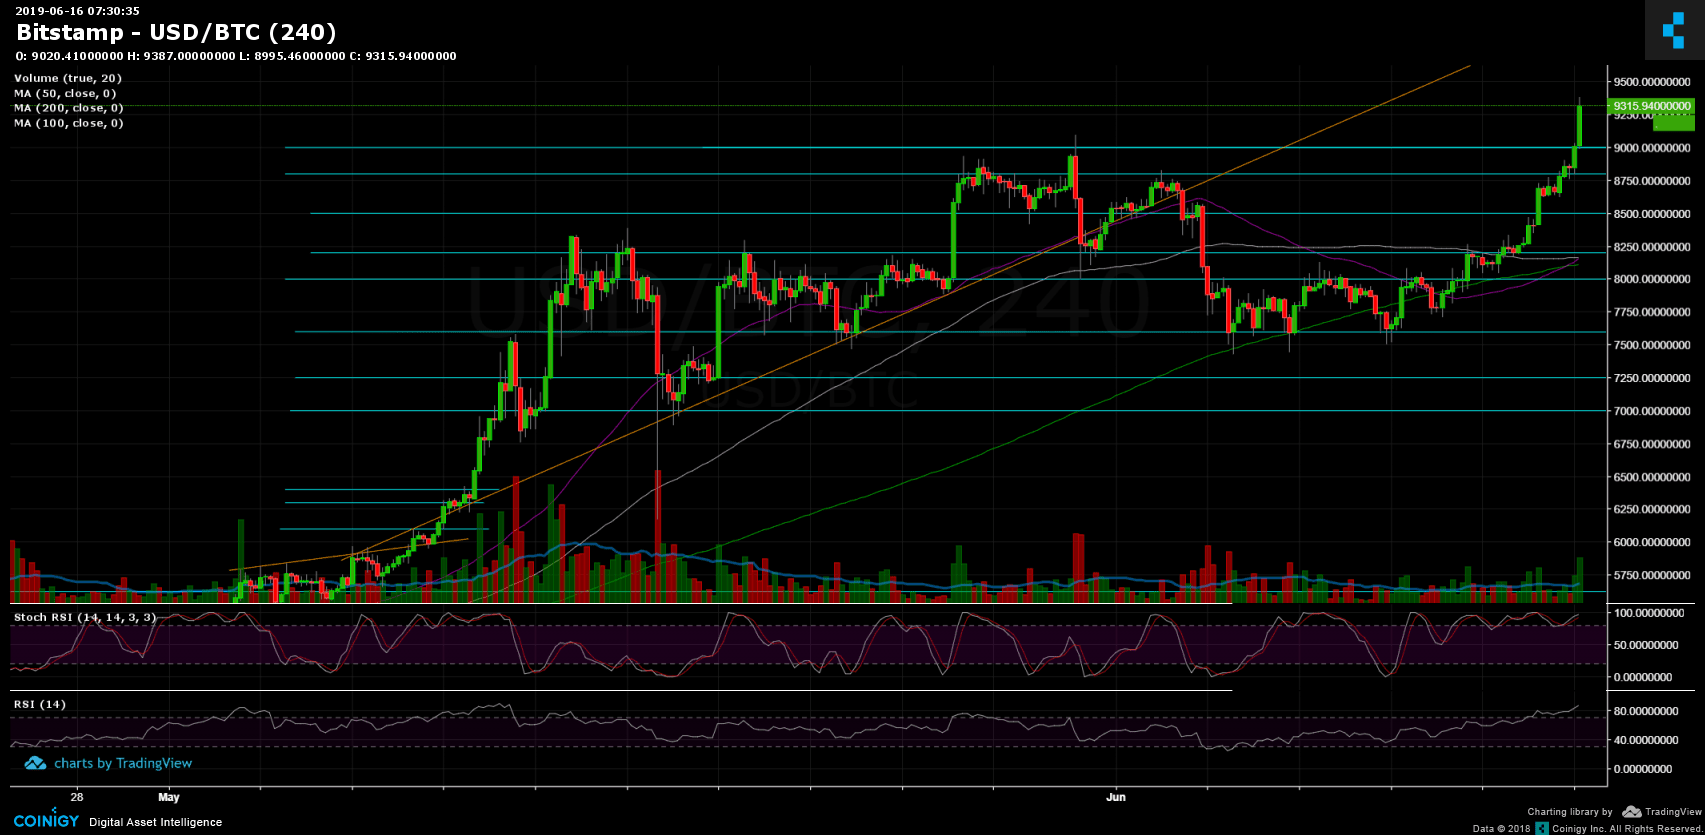
Following the breakout, Bitcoin is now aiming for higher levels, which are old resistance levels from the bearish 2018. The next significant resistnace level lies at $9400. Above is $9600 and the legendary level of $10,000, which seems closer than ever in the past year.
From the bearish side, Bitcoin has set the $9000 – $9100 as its first support area, besides lies $8800, before lower support levels at $8500, $8400, $8200 – $8250 and $8100.
– Trading Volume: The volume during the weekend isn’t very significant. It will be interesting to see how this move continues to the new week.
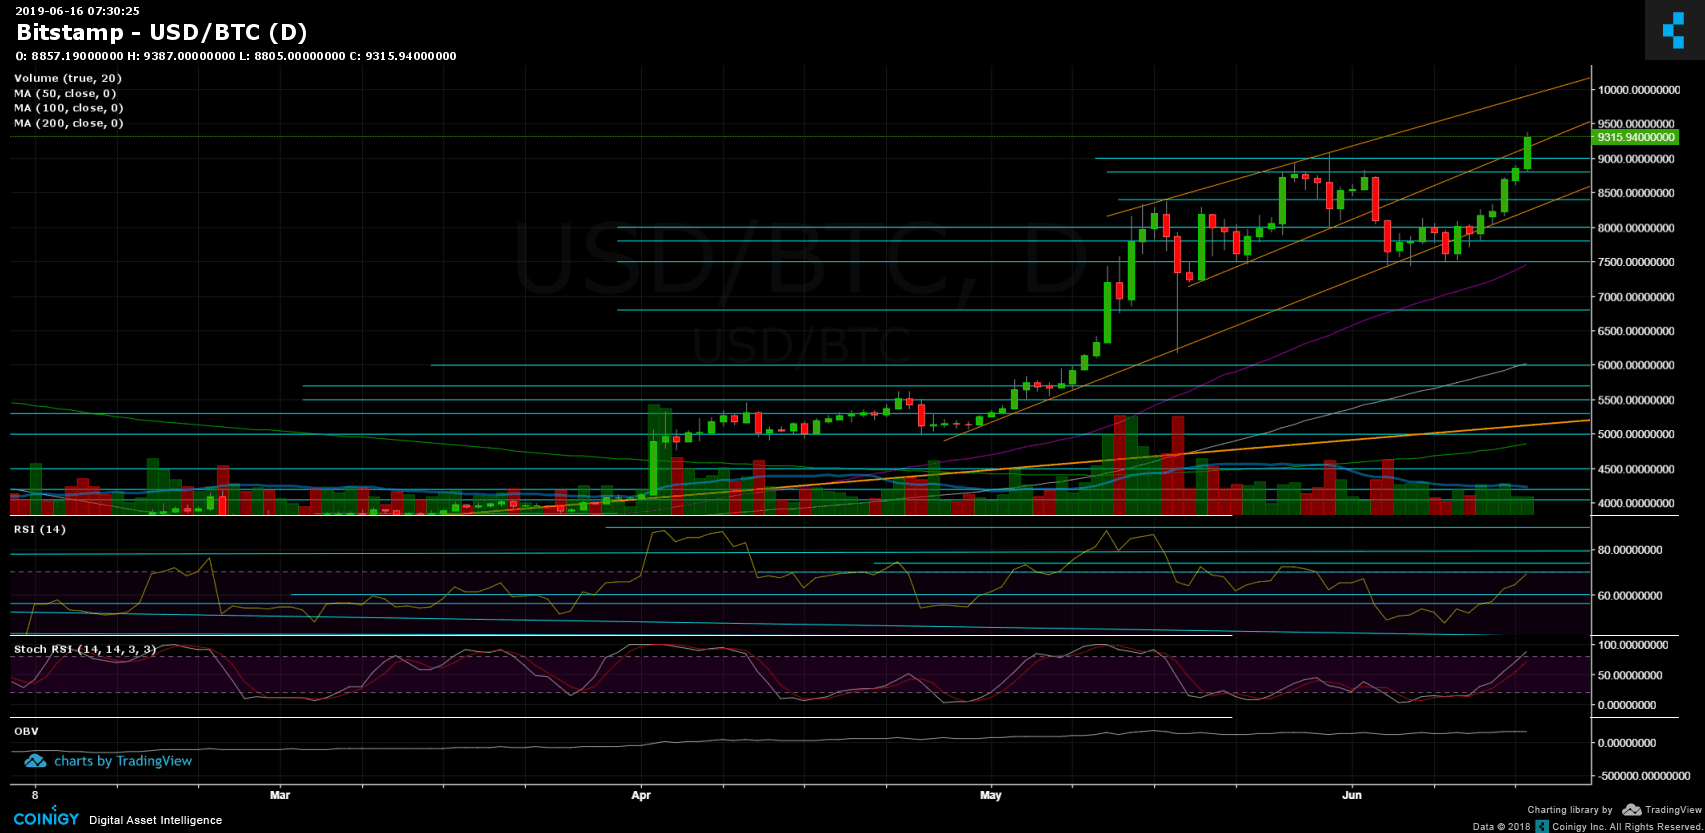
– Daily chart’s RSI: The RSI had produced a fabulous bullish move, and now facing the 70 RSI resistance level. Stochastic RSI is getting into the oversold territory; however, there is space to go up here.
– BitFinex open short positions: Along with the rising Bitcoin, the short positions continue to rise rapidly: There are now 24.8 K BTC of open short positions, which is the highest level of the past 30 days.