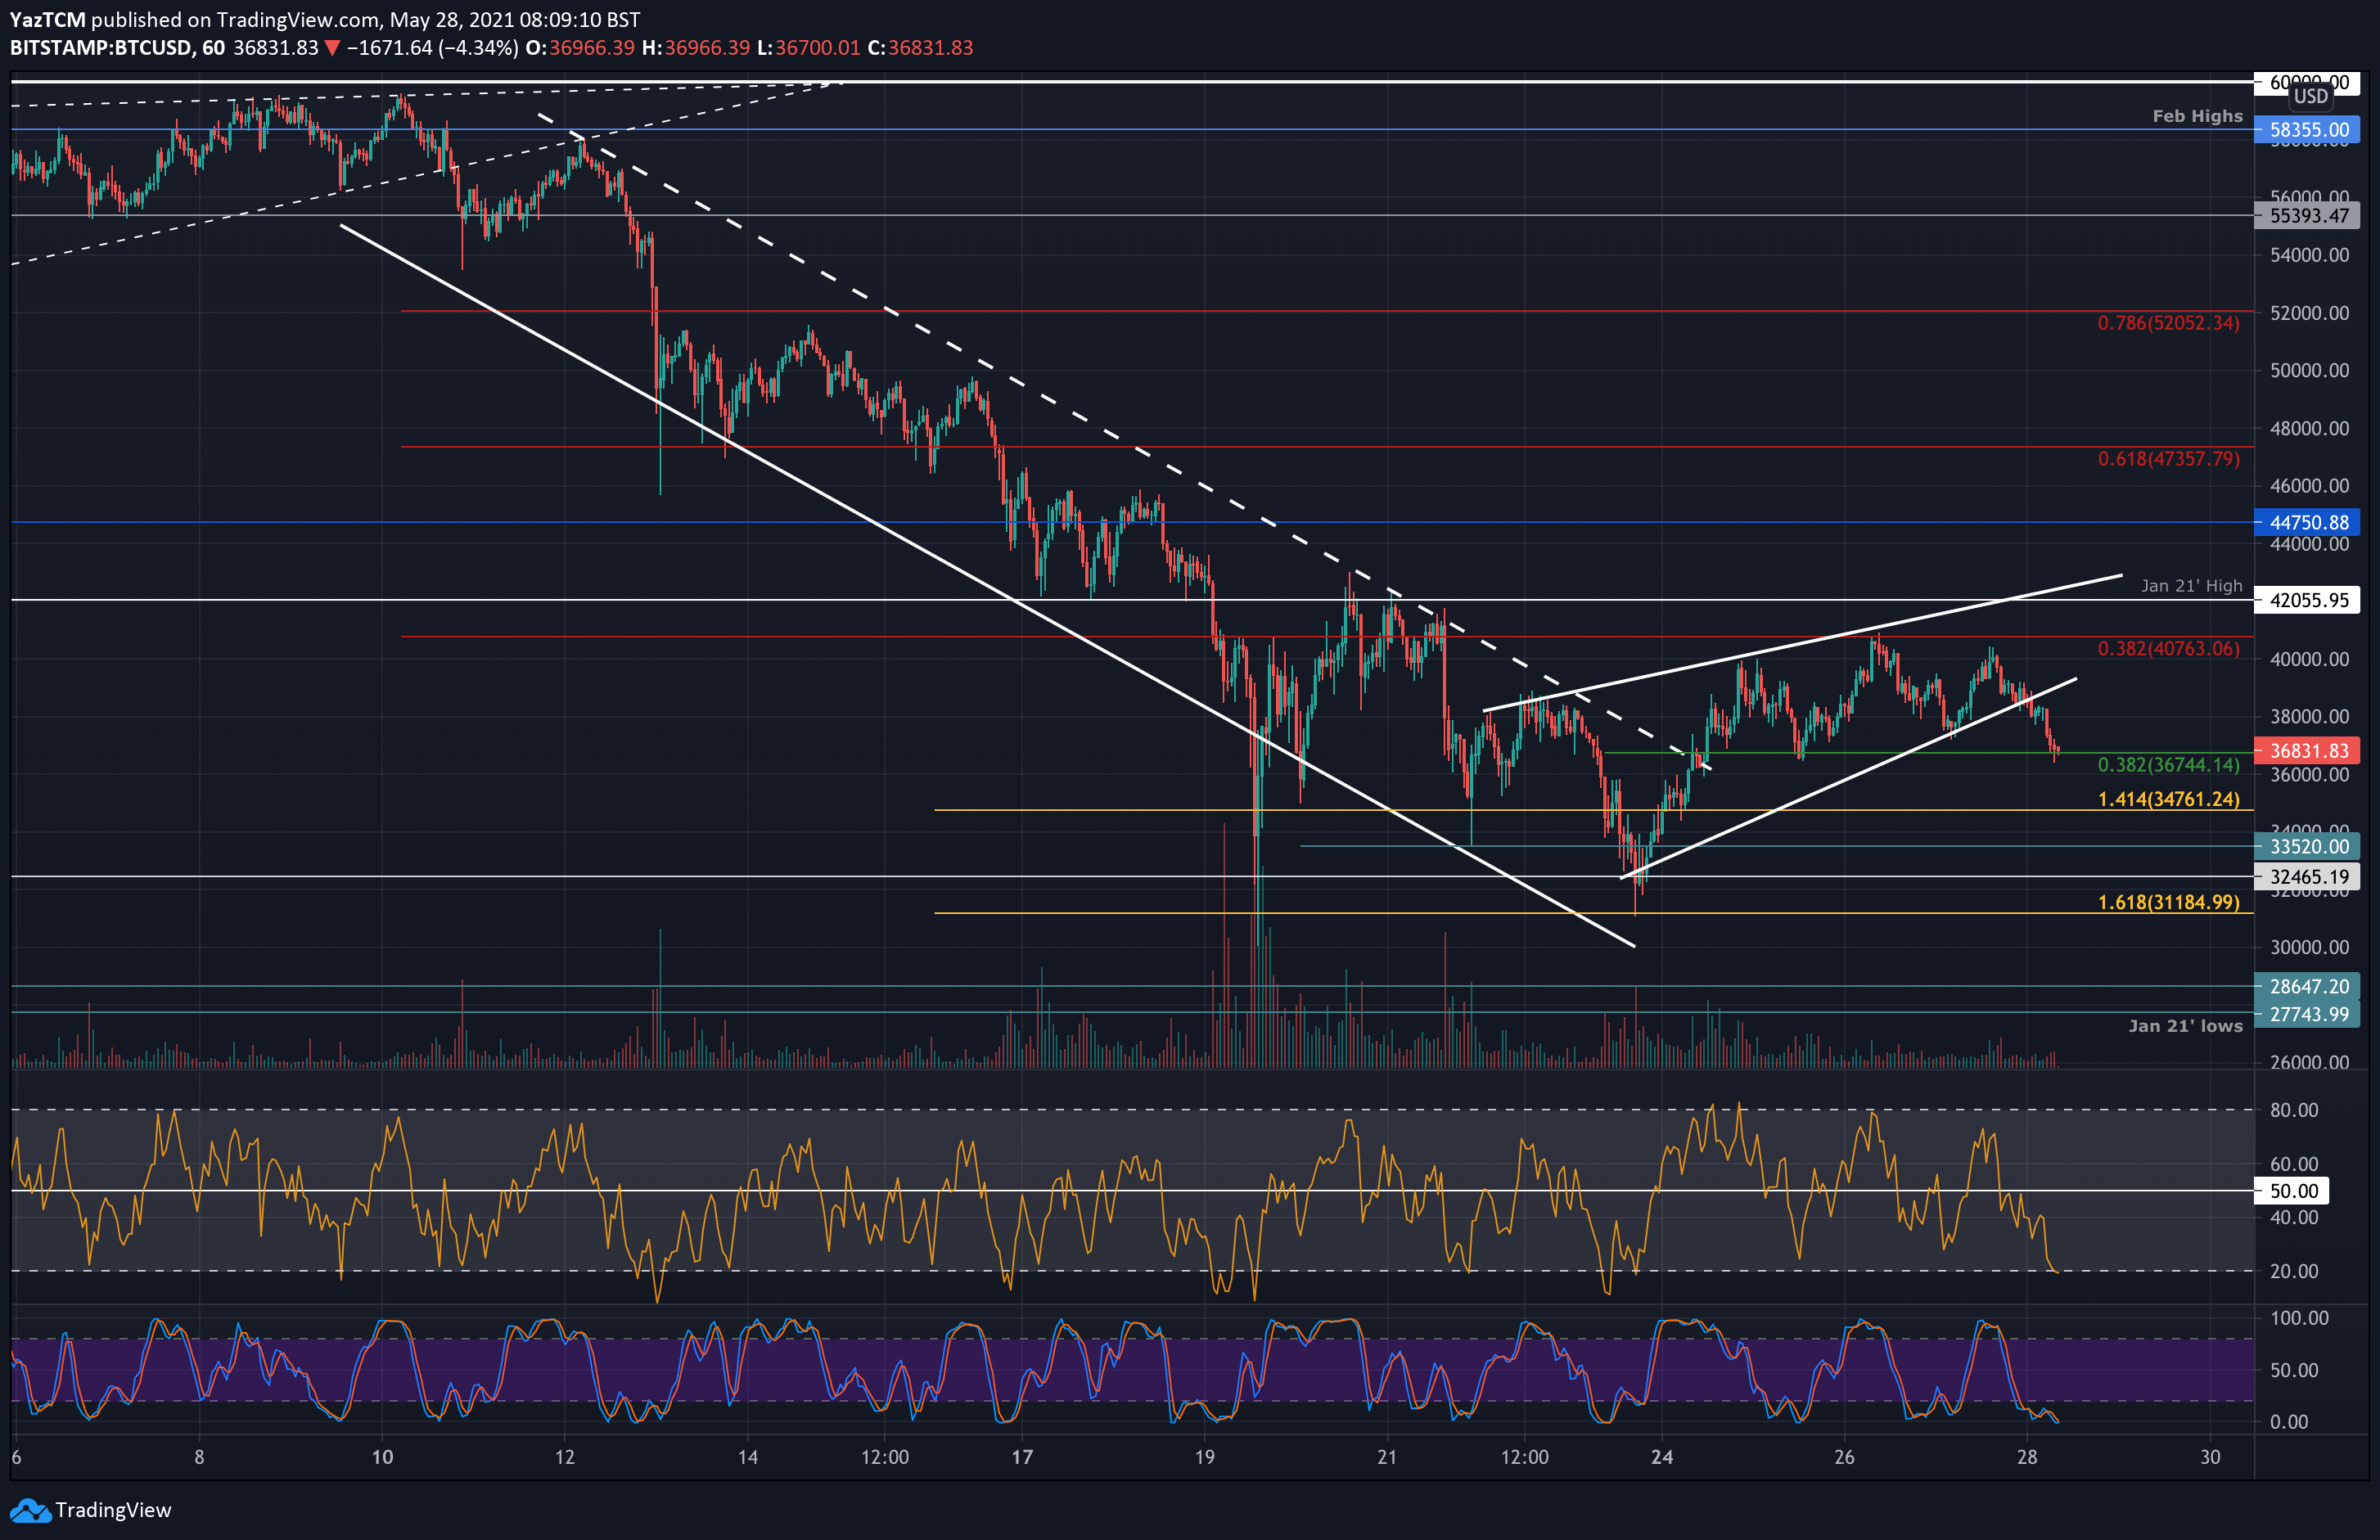
BTC/USD 1-Hour Chart. Source: TradingView.
Bitcoin is down by a sharp 3.5% today after another failed attempt to breach resistance at $40,000 yesterday.
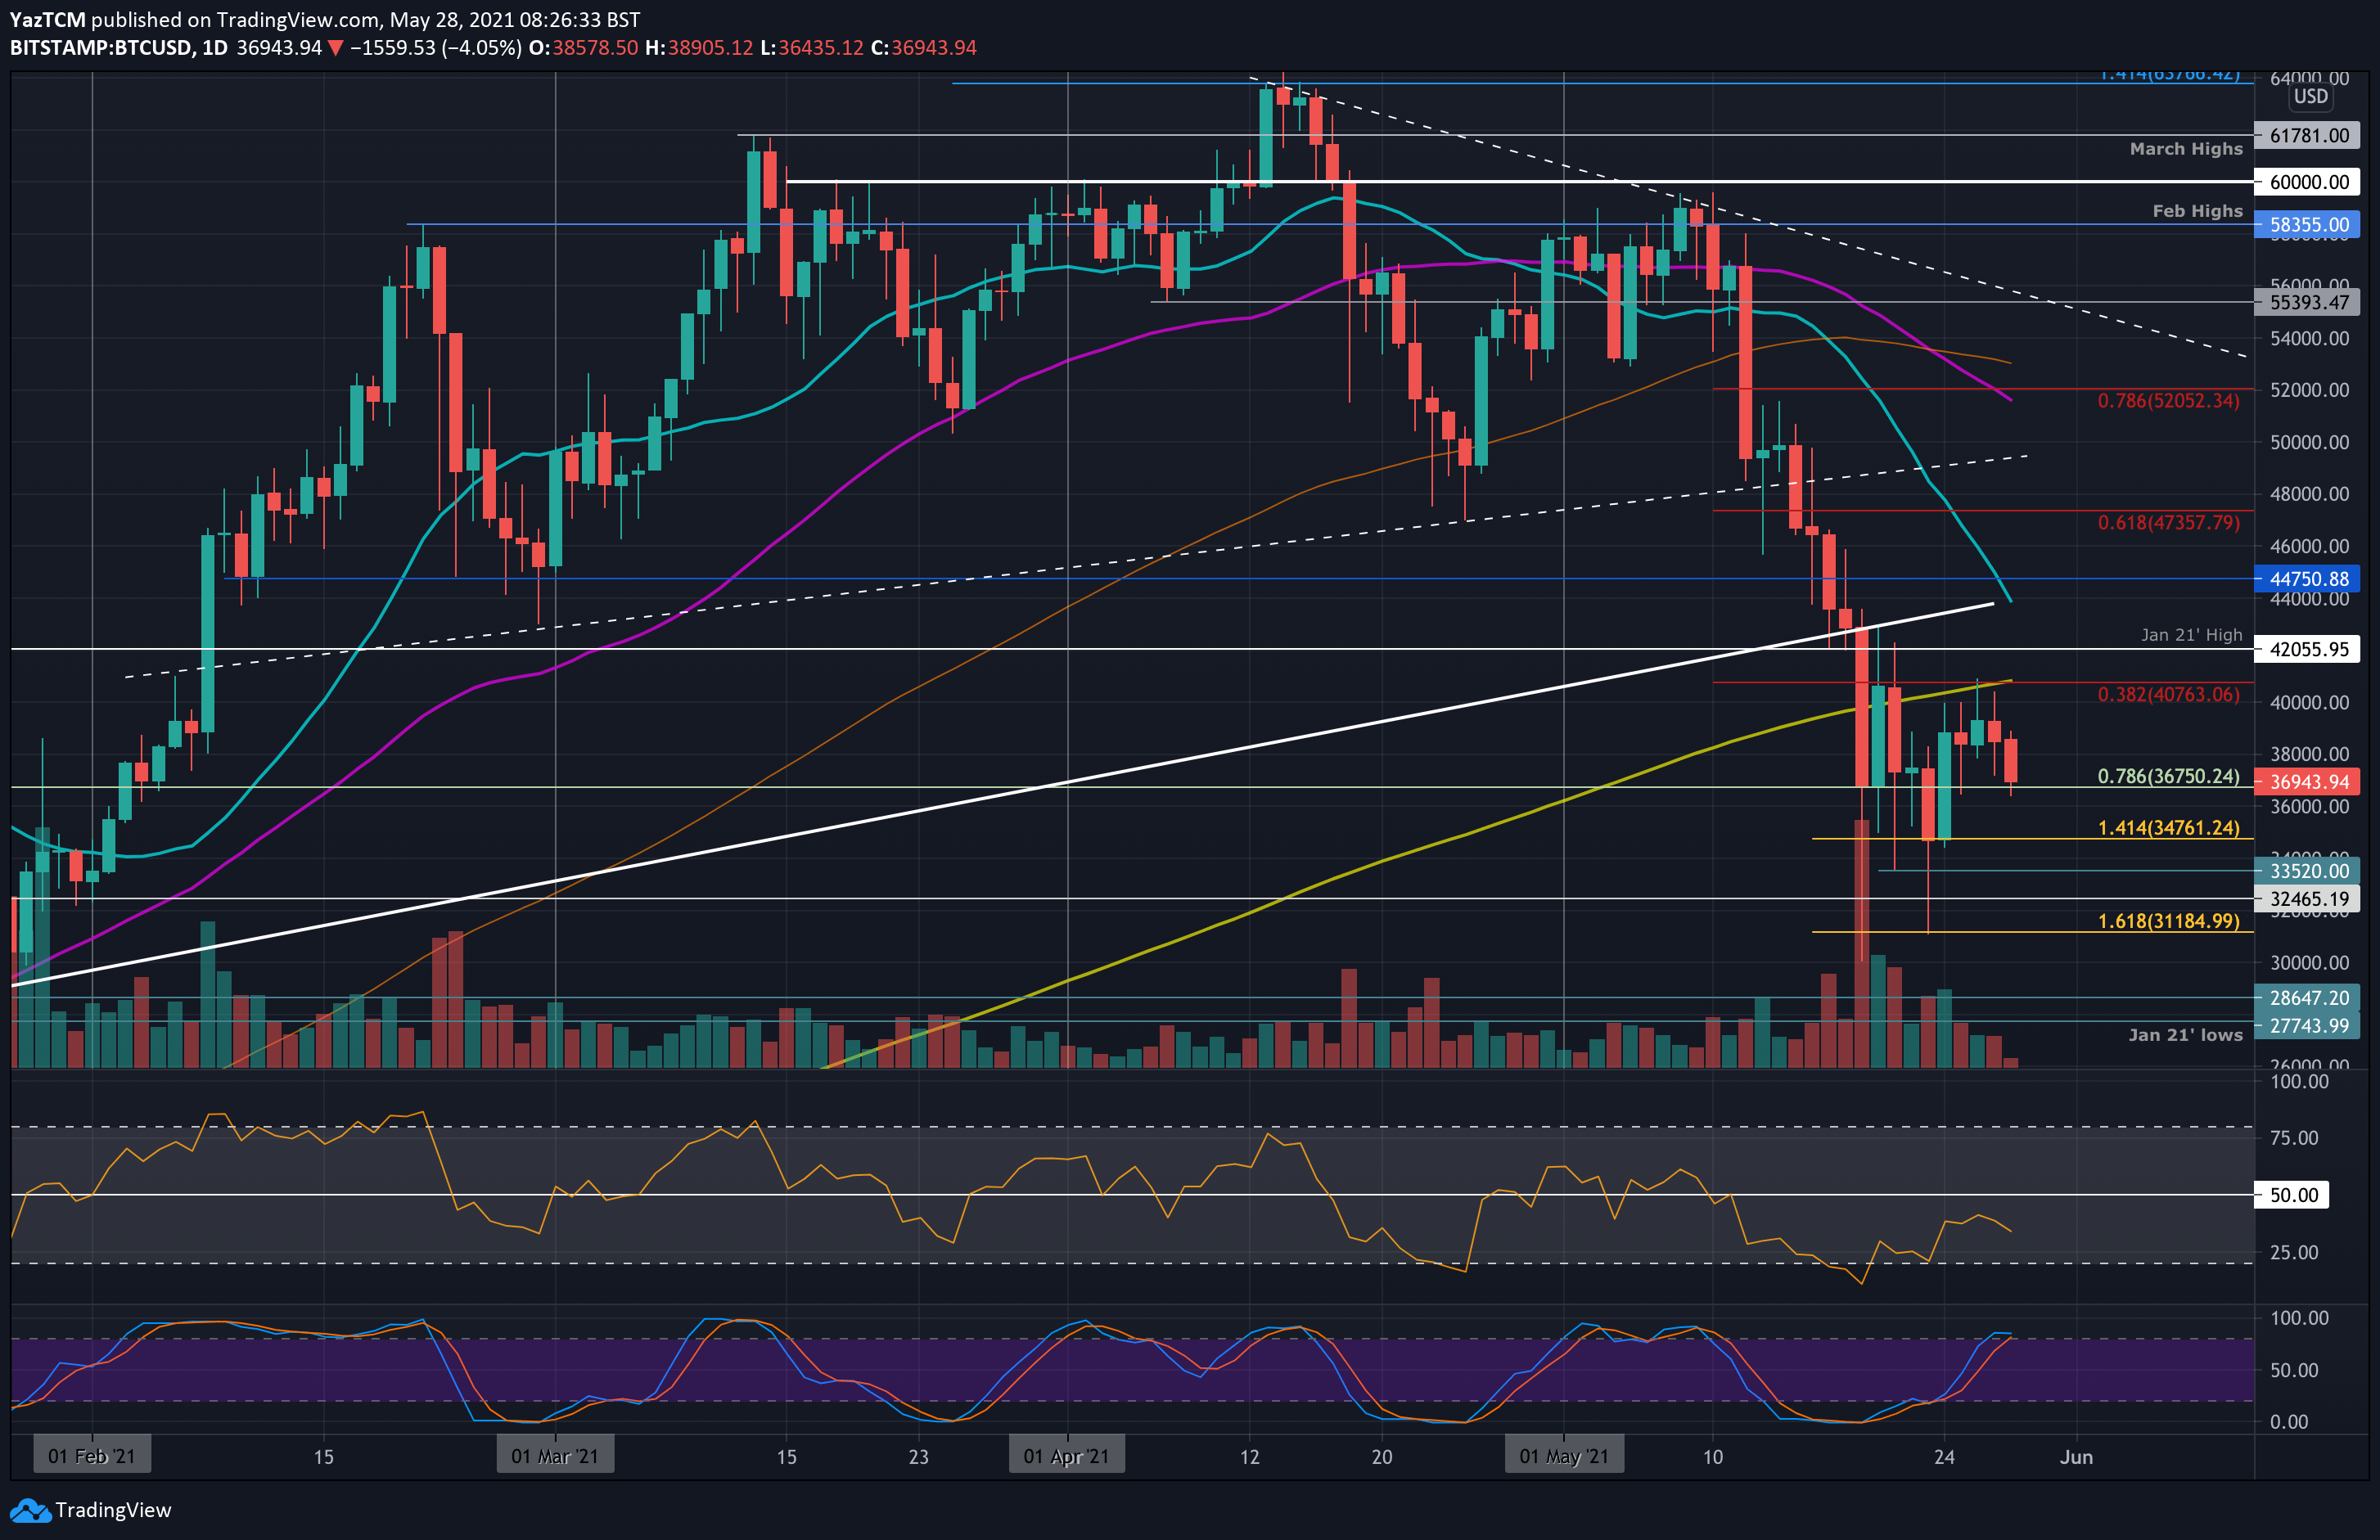
A quick recap of the volatile week BTC had: following a second dip into the $30-31k area, the cryptocurrency found solid support at $34,700 (downside 1.414 Fib Extension) on Sunday and started to recover throughout the week.
On Wednesday, bitcoin managed to briefly penetrate resistance at $40,000 to reach as high as $40,765.
Unfortunately, it could not break the combined resistance there – provided by the 200-day moving average line, a bearish .382 Fib, and the upper angle of a short-term rising wedge pattern. From there, BTC headed lower until the market found support at the lower boundary of this wedge.
Yesterday, bitcoin bounced from the lower angle of the wedge and made another failed attempt above $40,000. Since being rejected at $40K, BTC rolled over and fell beneath the short-term wedge after sliding below $38,000. It continued until finding the current support, as of now, at $36,745, provided by a short-term .382 Fib.
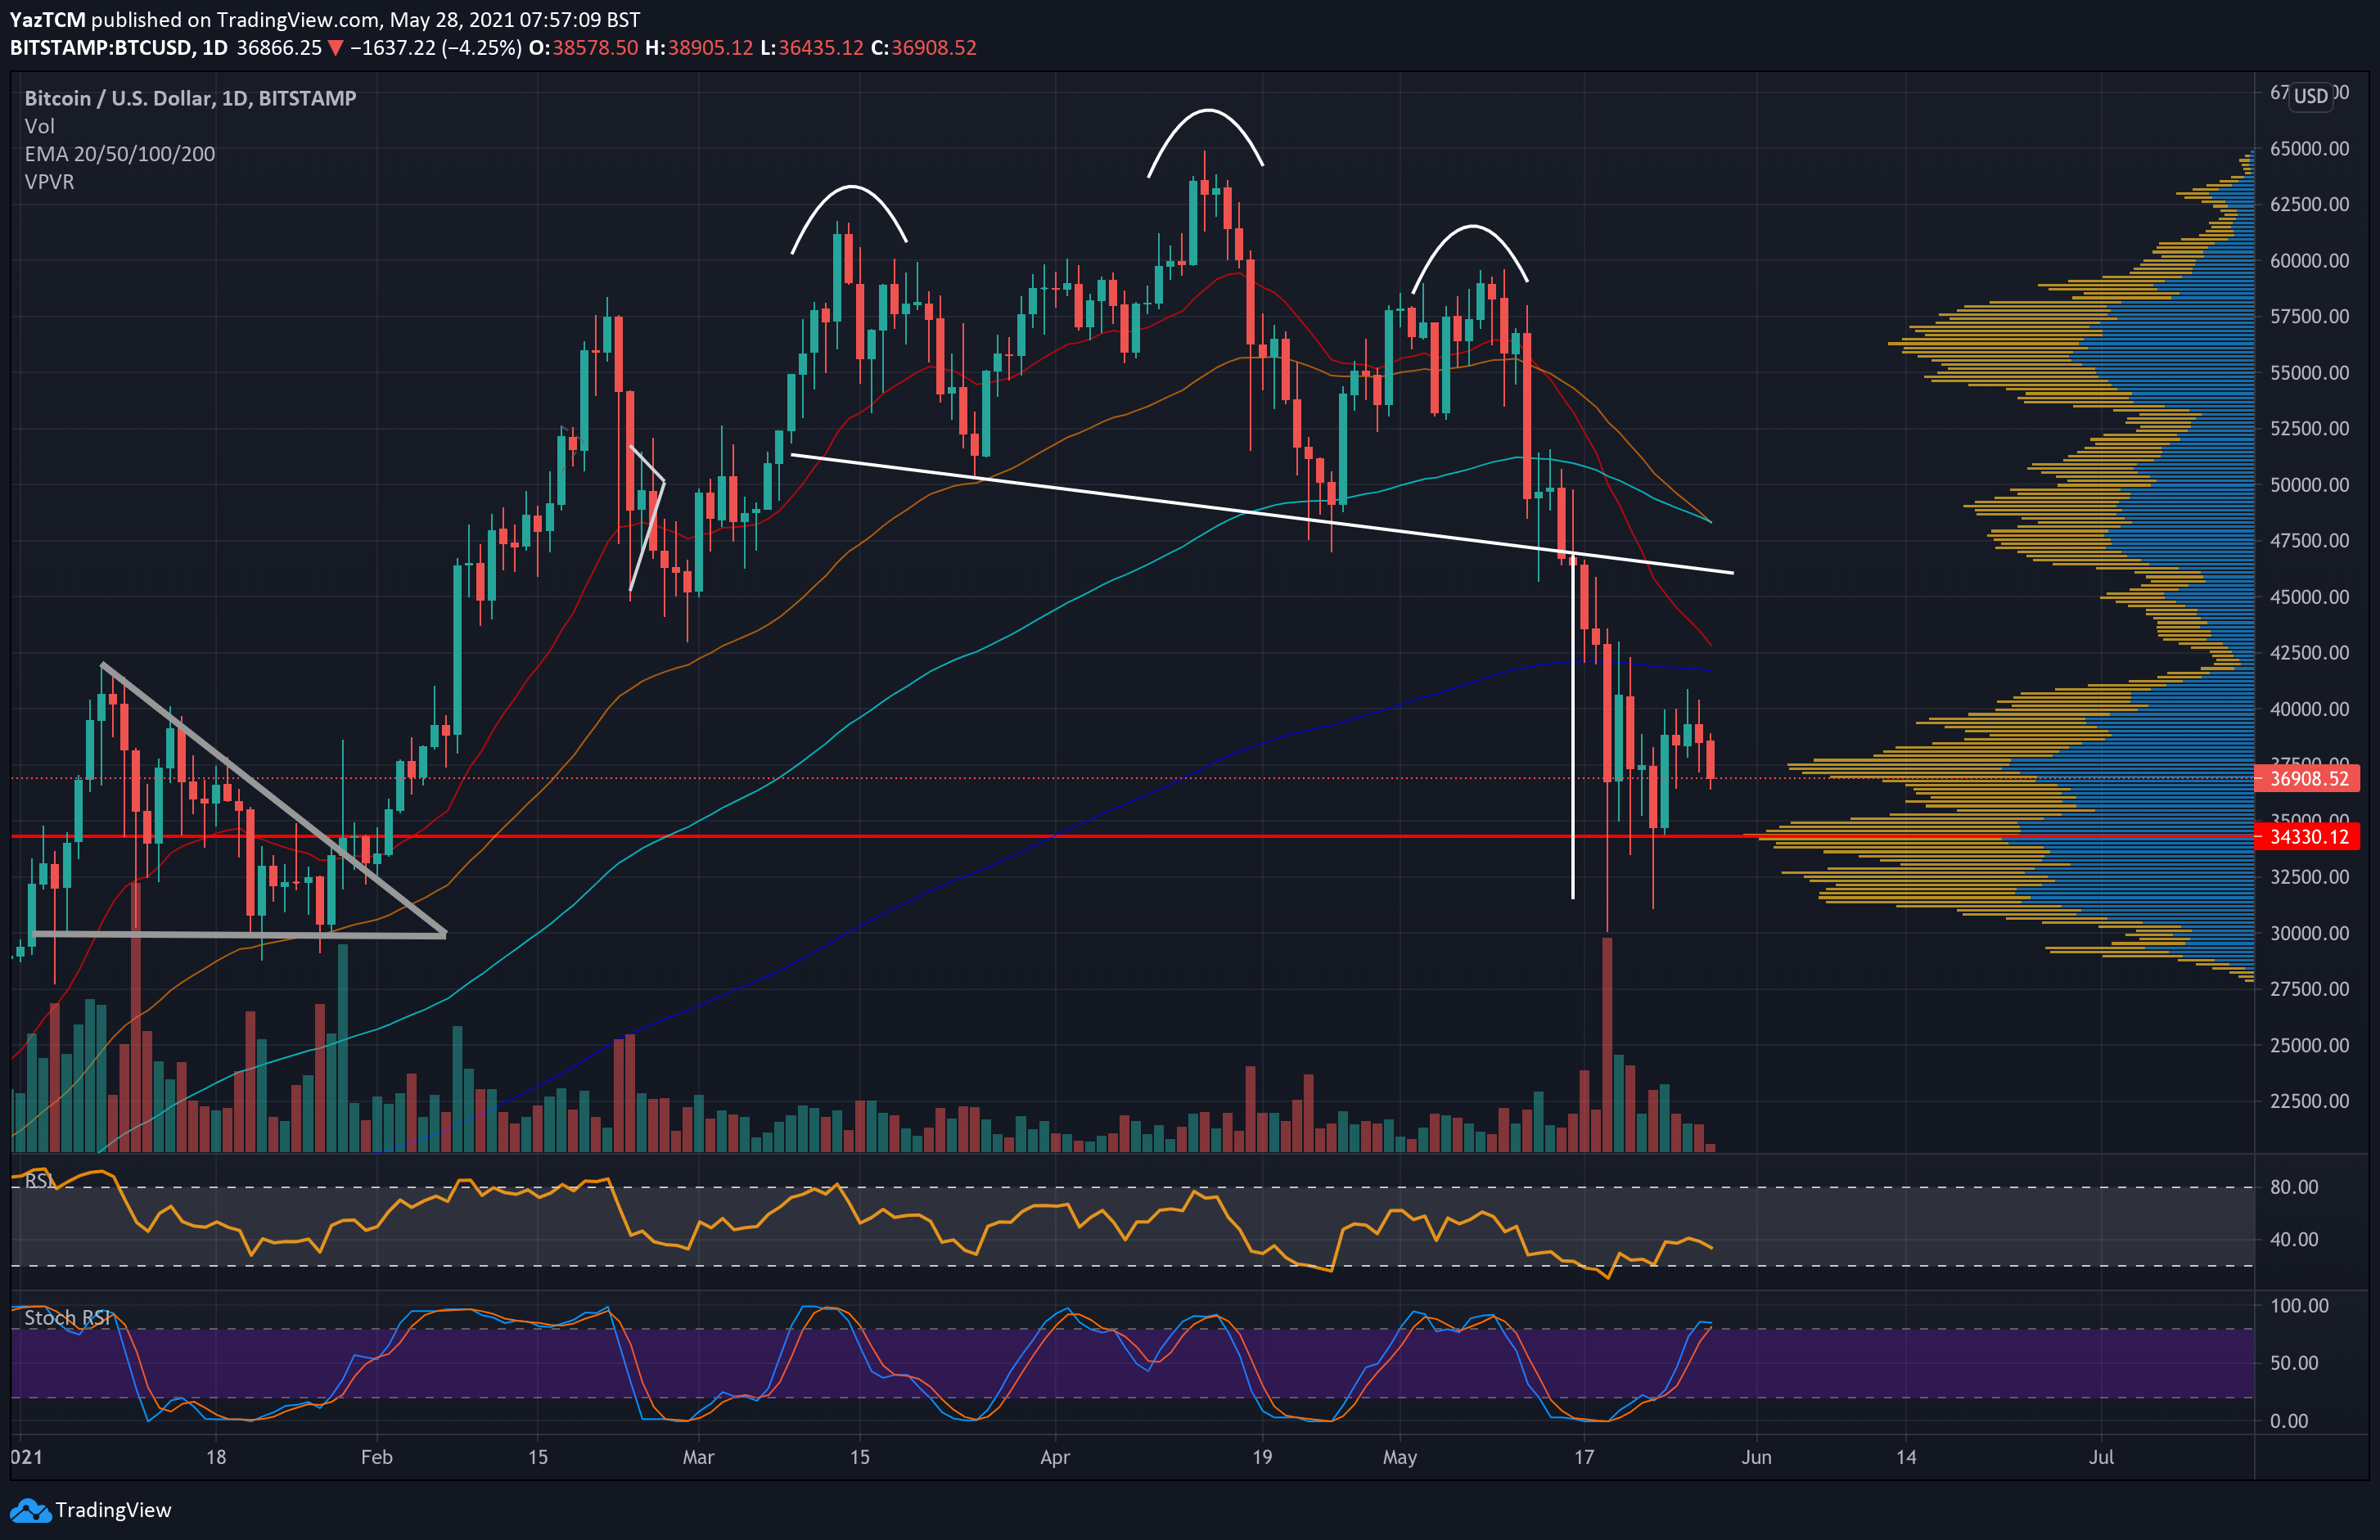
Interestingly, the volume profile for the entire period of 2021 shows that the most volume was traded around $34K – the level where Sunday’s daily candle closed. This zone is likely to be a confluence zone of both buyers and sellers, and we can expect them to continue “fighting” around this level until there is a clear winner. A break beneath this level is likely to cause BTC to retest $30K.
Key Support Levels: $36,750, $34,760 – $34,330, $33,520, $32,465, $31,185.
Key Resistance Levels: $38,000, $40,000, $40,765, $42,000, $44,750.
Looking ahead, the first support lies at $36,750 (.786 Fib). This is followed by $36,000, $34,760 – $34,330 (downside 1.414 Fib Extension & volume profile PoC), $33,520, $32,465, and $31,185 (downsisde 1.618 Fib Extension and the current week’s low).
On the other side, the first resistance lies at $38,000. This is followed by $40,000, $40,765 (bearish .382 Fib & 200-day MA), $42,000 (Jan 2021 high), and $44,750.
The RSI is now pointing downward again, indicating that the bearish momentum is starting to increase. Additionally, the 4-hour RSI is now trading in extremely oversold conditions, indicating the strength of the current bearish momentum.