Bitcoin price fell sharply in November 2018 and tanked to $3120 in December 2018. Over the first quarter of 2019, it mostly remained range bound.
However, with the recent surge in Bitcoin price that broke above the strong psychological resistance near $5,000, analysts are once again becoming optimistic about the long-term prospects of the quintessential cryptocurrency on the face of the earth.
Veteran trader and technical analyst Peter Brandt, the author of the Diary of a Professional Commodity Trade posted a tweet on April 5 identifying a parabolic phase for Bitcoin.
Subsequently, he also posted a detailed technical analysis claiming there is a good possibility that we might see a sustained bullish run in the coming months of 2019.
“I have written exhaustively about the analog nature of the current market to the bear market of 2014-2015 and the subsequent parabolic advance into 2017 high,” said Peter Brandt in his analysis and he compared the current development to the double bottom pattern formation in 2015.
Either from Dec ’18 low or from retest of same (circa analog dbl bottom in 2015) it would not surprise me if $BTC enters new parabolic phase. $btcusd pic.twitter.com/XV89Qz7P4n
— Peter Brandt (@PeterLBrandt) April 5, 2019
According to him, the current pattern development will require the Bitcoin price to go down towards $3215, and form a double bottom, which is considered to be a bullish technical pattern.
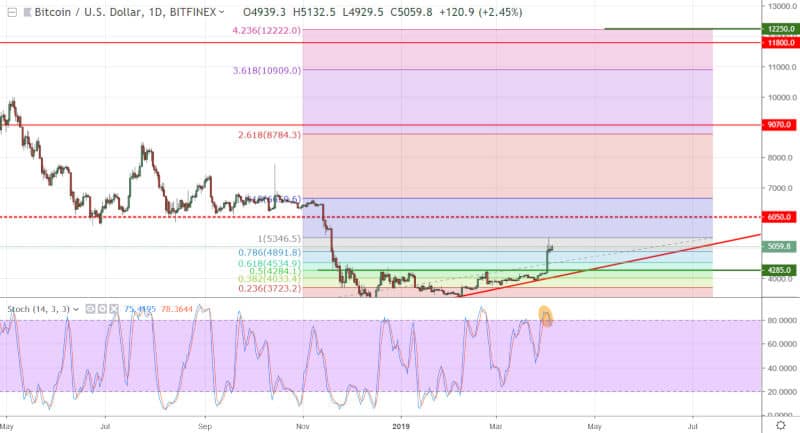
The analysis of Peter Brandt is based on the weekly price chart of Bitcoin, and in the long-term, it makes some valid points. However, it is worth noting that to form the double bottom pattern, Bitcoin price needs to fall by almost $2000 from its current level. To do so, it first needs to break below the strong support around $4285, and then cross the well-respected daily uptrend line to reach the next significant support near $3215.
As per our previous analysis, Bitcoin price is already struggling to hold the ground near $5000 following the recent bullish move.
Nonetheless, if we consider the $5335 high to hold its ground till the said double bottom pattern forms, it will allow us to plot Fibonacci retracement levels based on the low of $3215 and high of $5335. Doing so, it plots the 423.6% retracement at $12,250.
In the market, patterns develop from the reason that investors mimic their past behavior. However, the scenario painted by Peter Brandt will require some improbable events to happen to mimic the double bottom line pattern formed in January and August 2015.
Over the last week, we had several bullish predictions, including CEO of Binance, Changpeng Zhao, said substantial amount of “big money” is waiting to enter the market. Also, Forbes contributor Naeem Aslam predicted Bitcoin would soon trade near the $100k mark.
While we had this type of outrageous predictions since the introduction of Bitcoin over the last ten years, only time will tell how far the miraculous Bitcoin will take us.