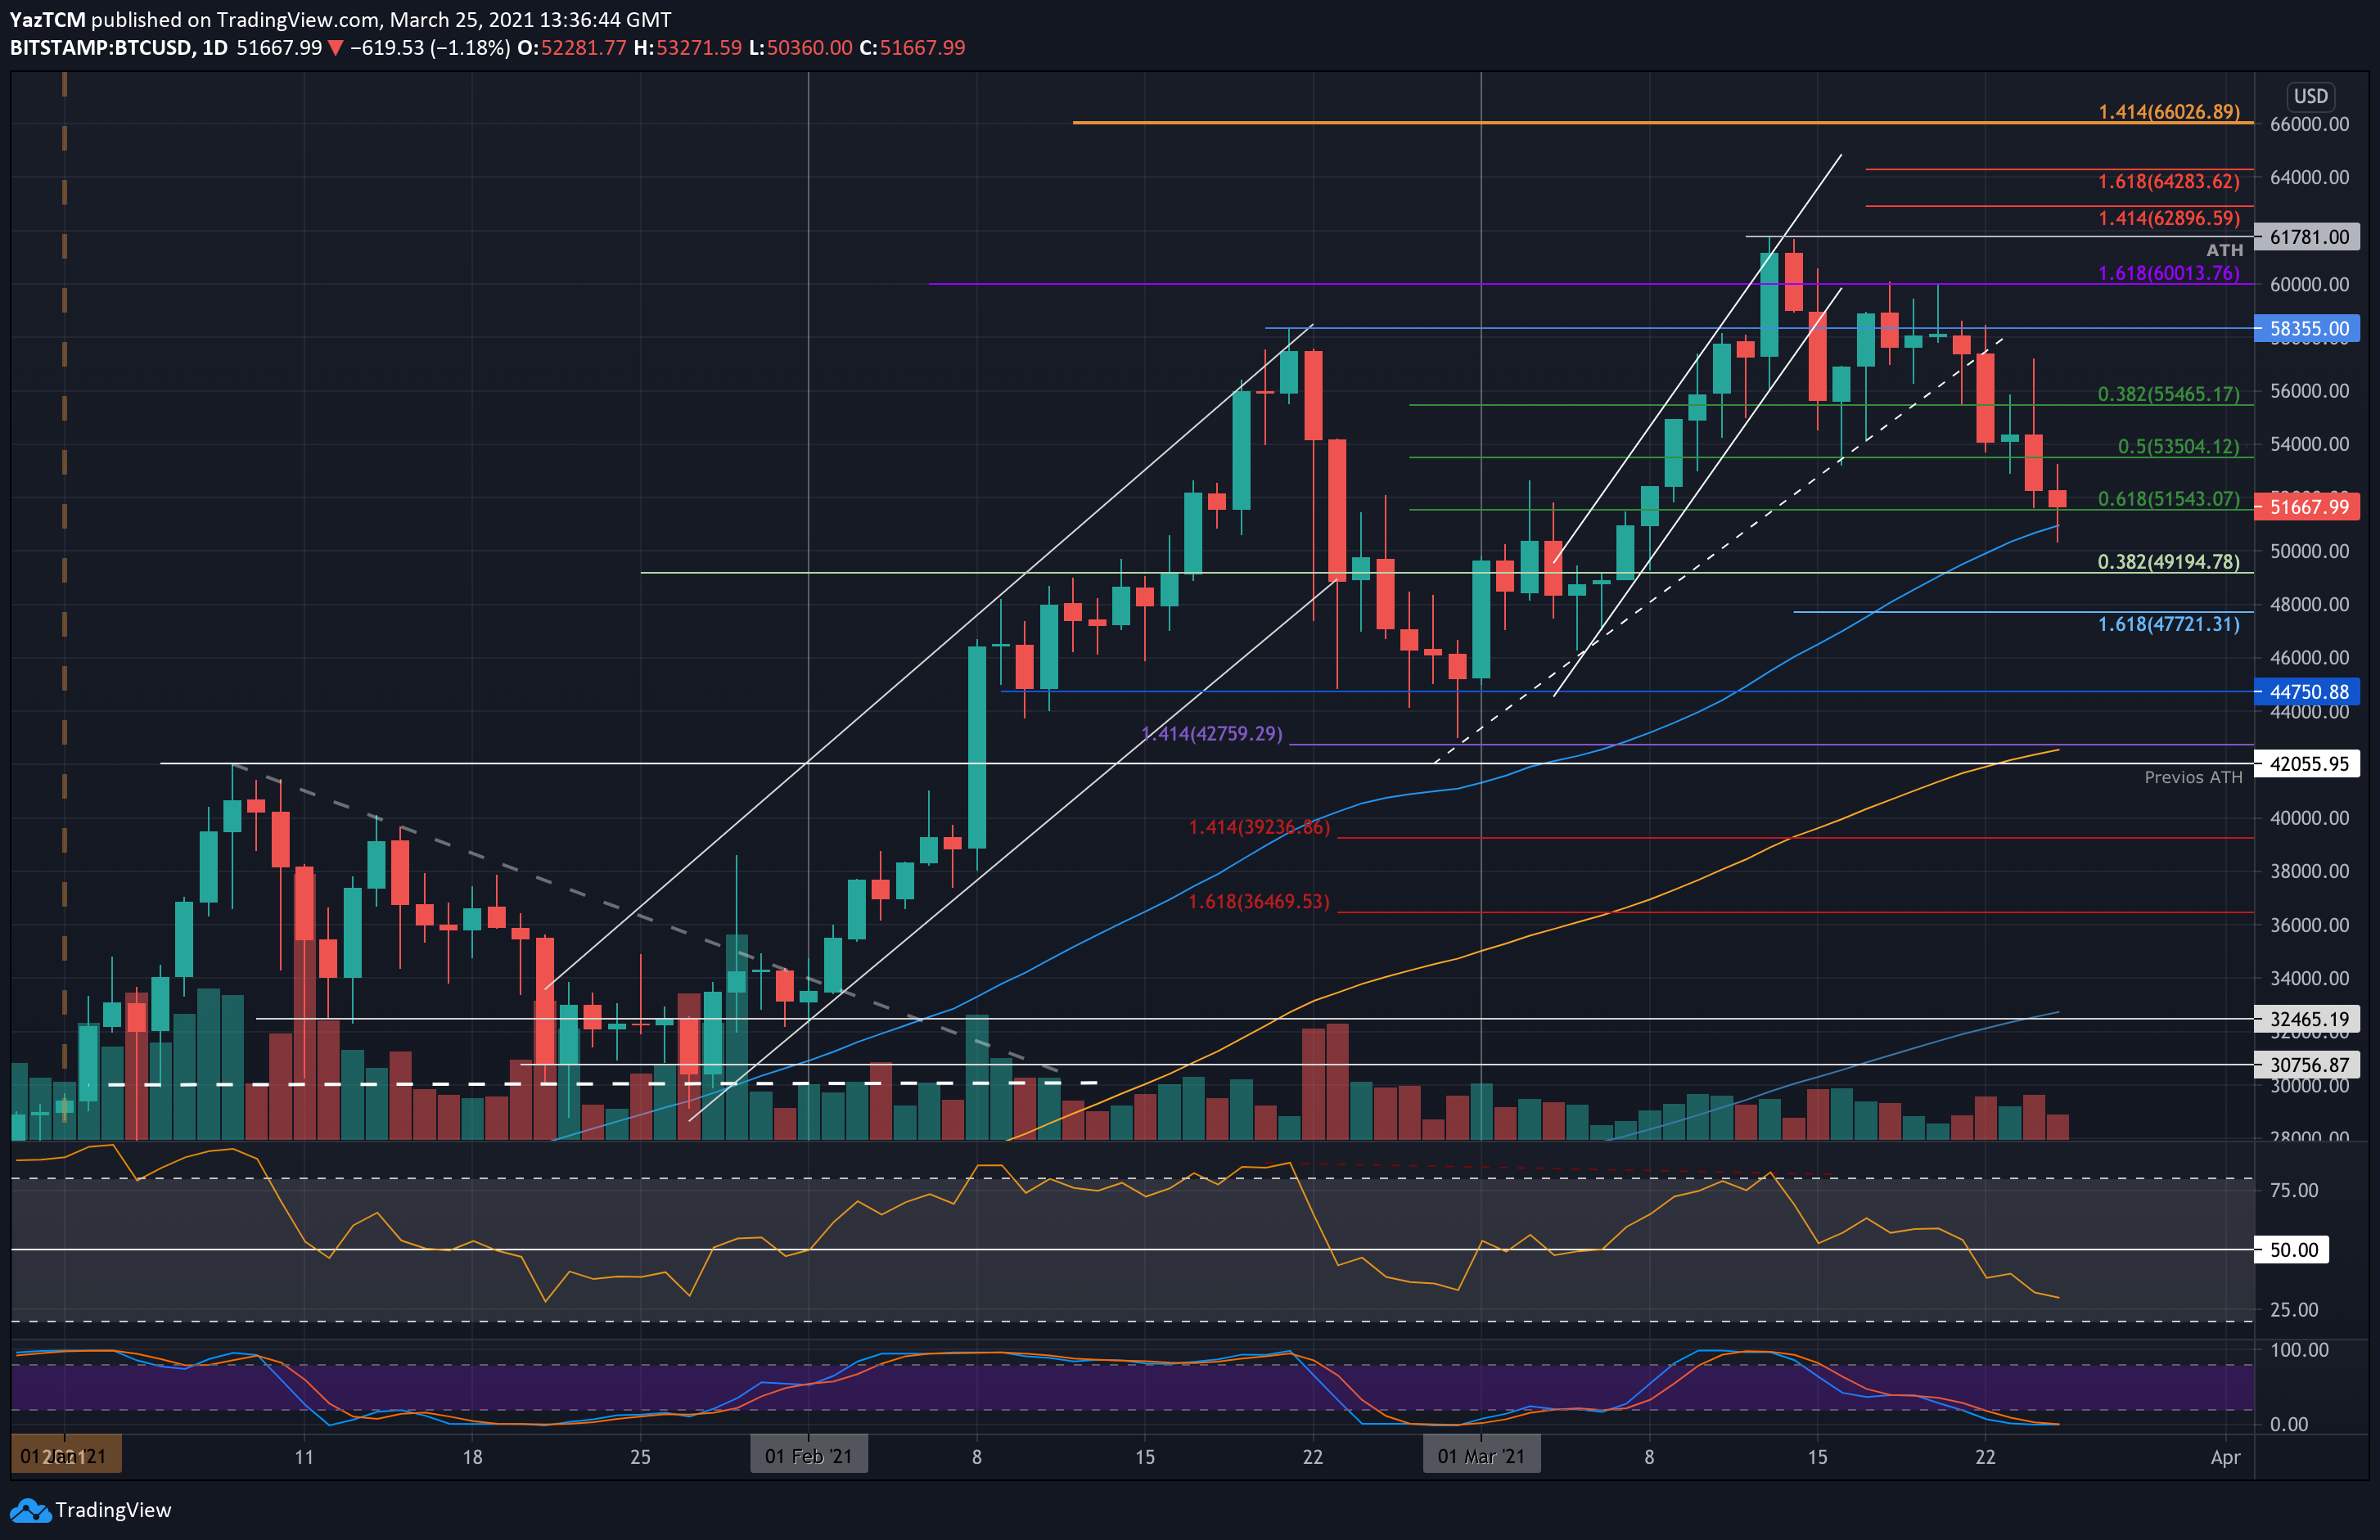
BTC/USD Daily Chart. Source: TradingView
Bitcoin dropped by a sharp 10% over the past 24 hours as it headed towards $50K. The cryptocurrency has been falling throughout the entire week after slipping beneath an ascending trend line around the previous ATH from February at around $58,300, back on Monday.
It initially found support at $54,000, but it was broken down yesterday, causing Bitcoin to fall further into the .618 Fib Retracement at $51,540. Today, the price decline continued as the 10% price fall caused BTC to record a current low of $50,360 according to Bitstamp.
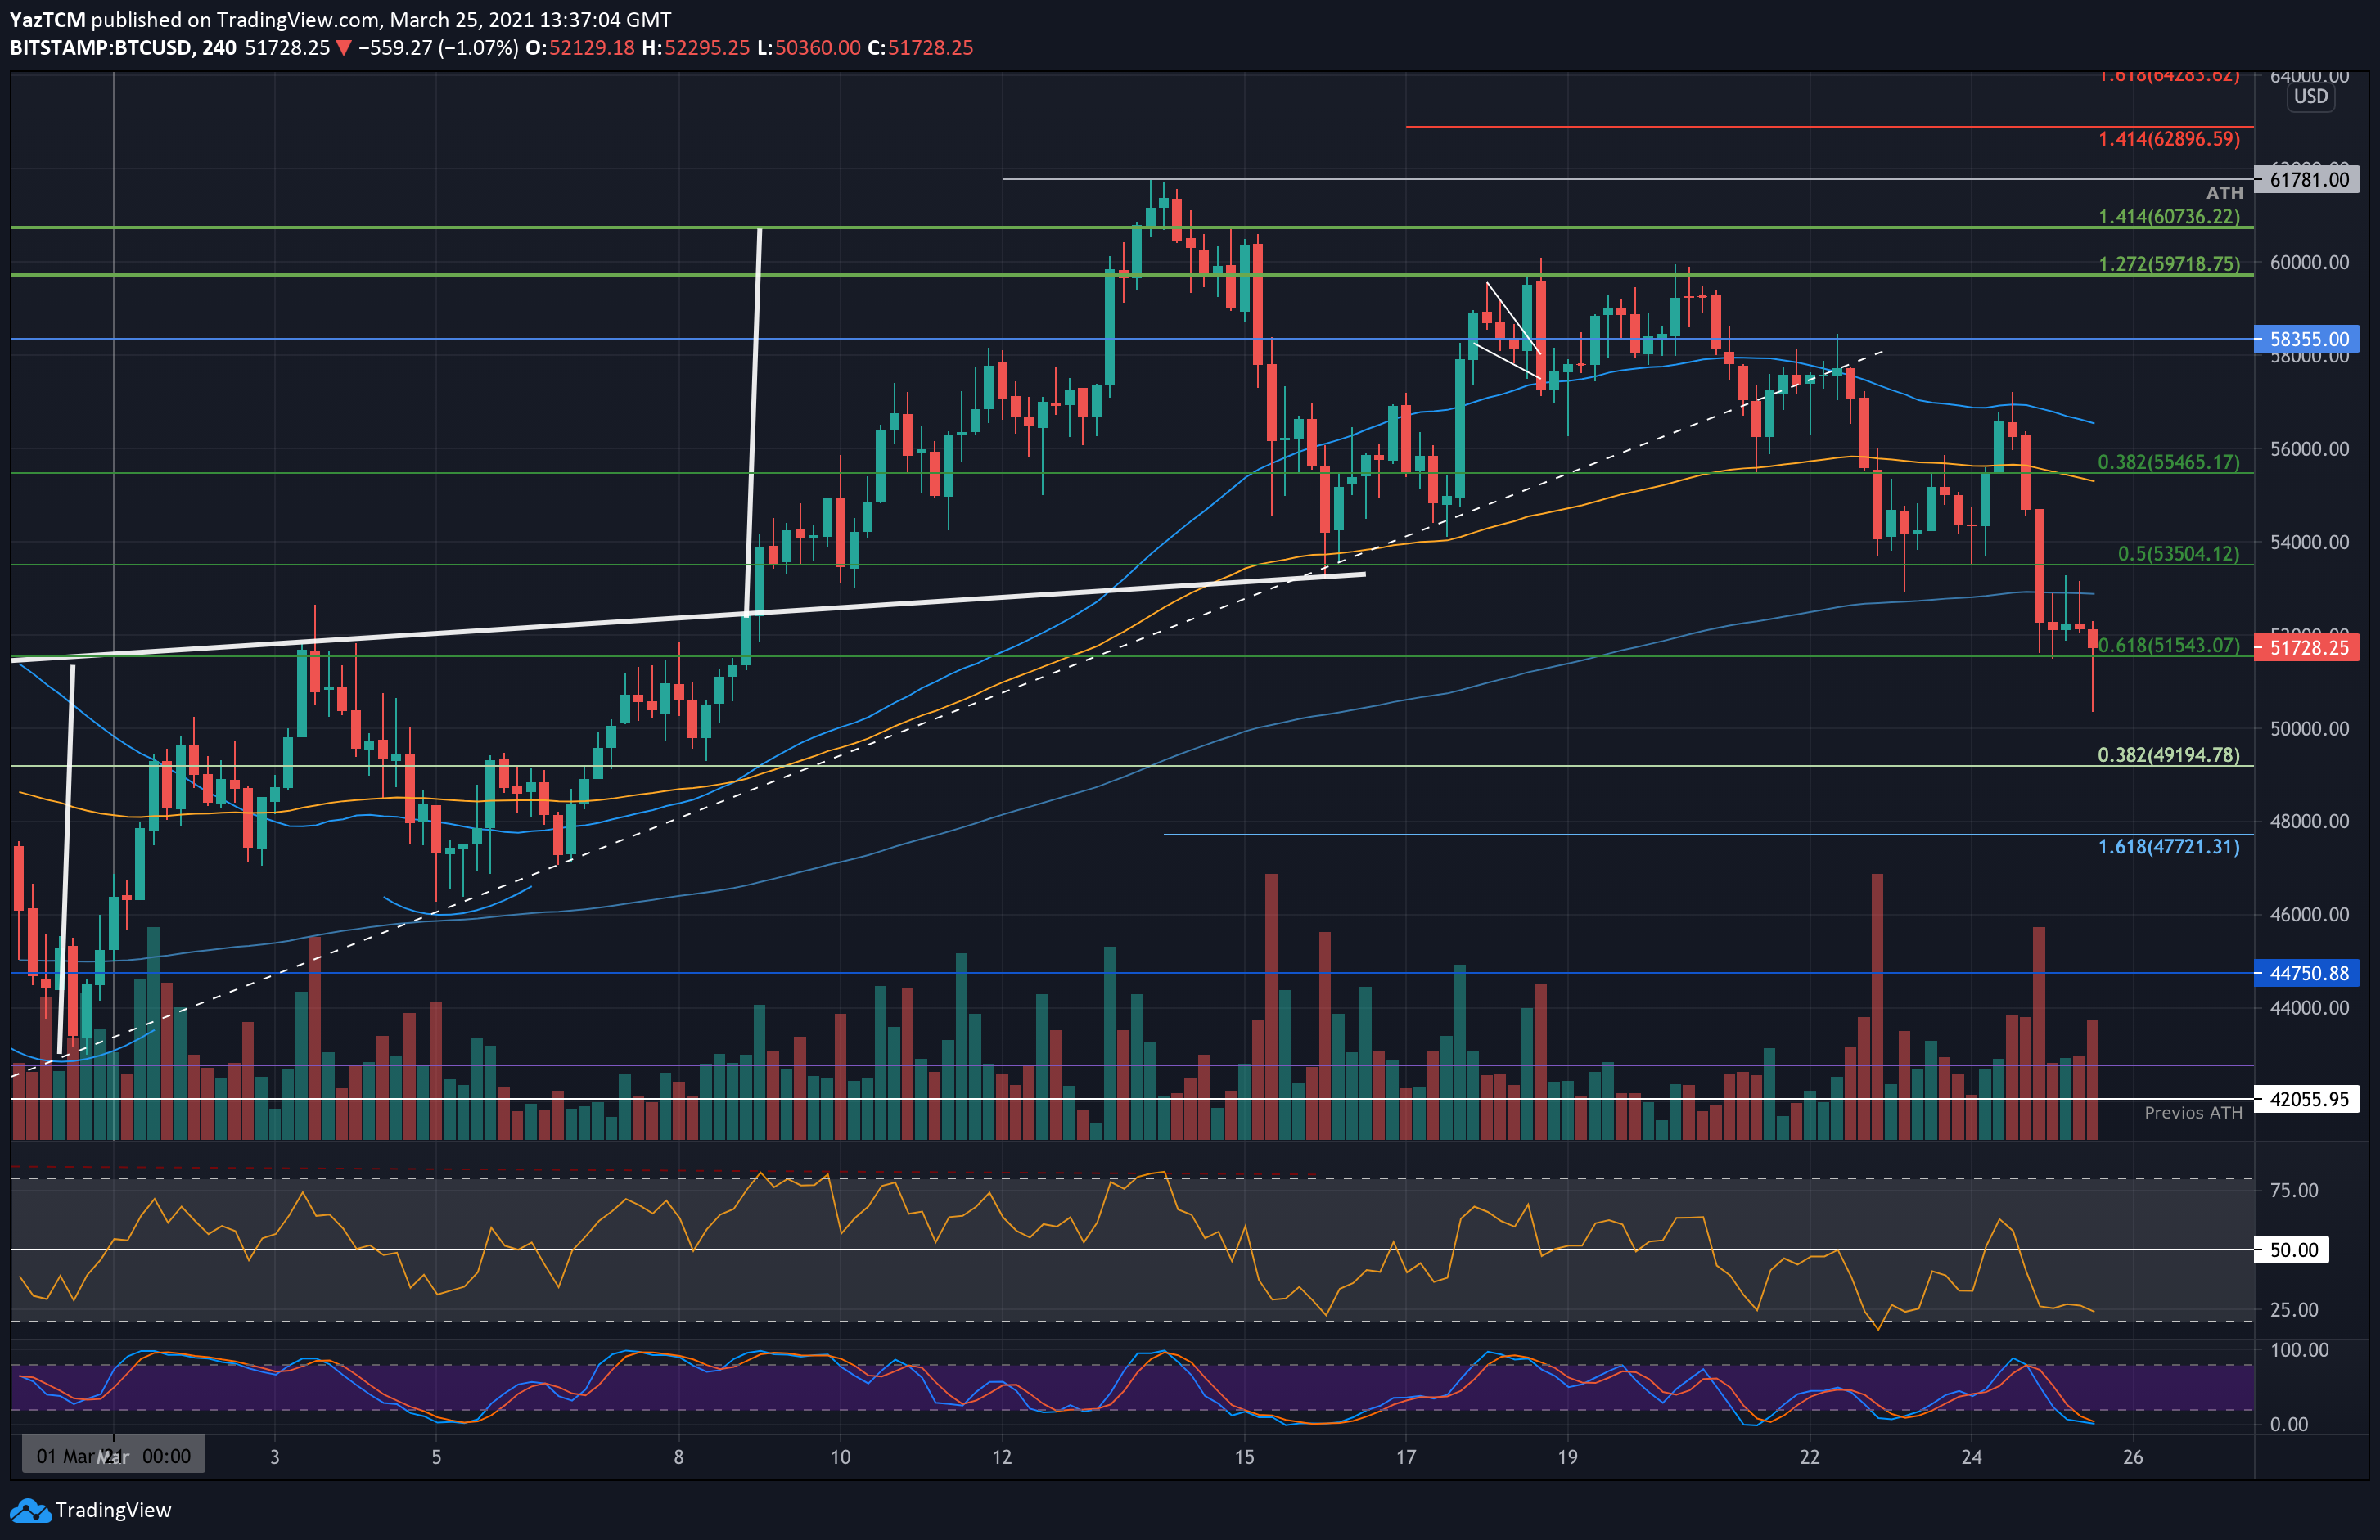
On March 20th Bitcoin was rejected trying to break through the $60k resistance level. Since then, BTC lost almost $10k of its value. In fact, $50,300 is the lowest price BTC was trading at since back on March 8th.
The bearish momentum follows the global markets. On Wednesday, major Wall Street indices saw 1-2% crashes, and today the bloodbath continues with Nasdaq deep in the red.
On a daily timeframe, Bitcoin broke down a critical ascending trend-line at around $54k and is now struggling to stay on top of the 50-day moving average line which is currently around the $51k mark. Besides, a daily close above the latter is the first condition to stay safe from a deeper plunge towards the mid 40k zone.
Key Support Levels: $51,540, $51,000, $50,000, $49,195, $47,700.
Key Resistance Levels: $53,500, $54,000, $56,000, $58,350, $60,000.
Looking ahead, the first level of support beneath $51,540 lies at $51,000 (50-day MA). This is followed by $50,000, $49,195 (.382 Fib Retracement), $47,700 (downside 1.618 Fib Extension), $46,000, and $44,750.
On the other side, the first level of resistance lies at $53,500 (ascending trendline which started forming in January). This is followed by $54,000, $56,000, $58,350, and $60,000 (this week’s high).
It is important to point out that the RSI is now the most oversold since mid-January as it falls beneath the 30 level. This indicates that the market sentiment is pretty bearish as the price drops. In this bull run, the last two times the daily RSI fell below 50 was the last days of the past two months. On both occasions, it took bitcoin no more than two weeks in order to record a new all-time high.
Moreover, the Stochastic RSI is extremely oversold, and a bullish crossover might give some hope for a bullish correction.