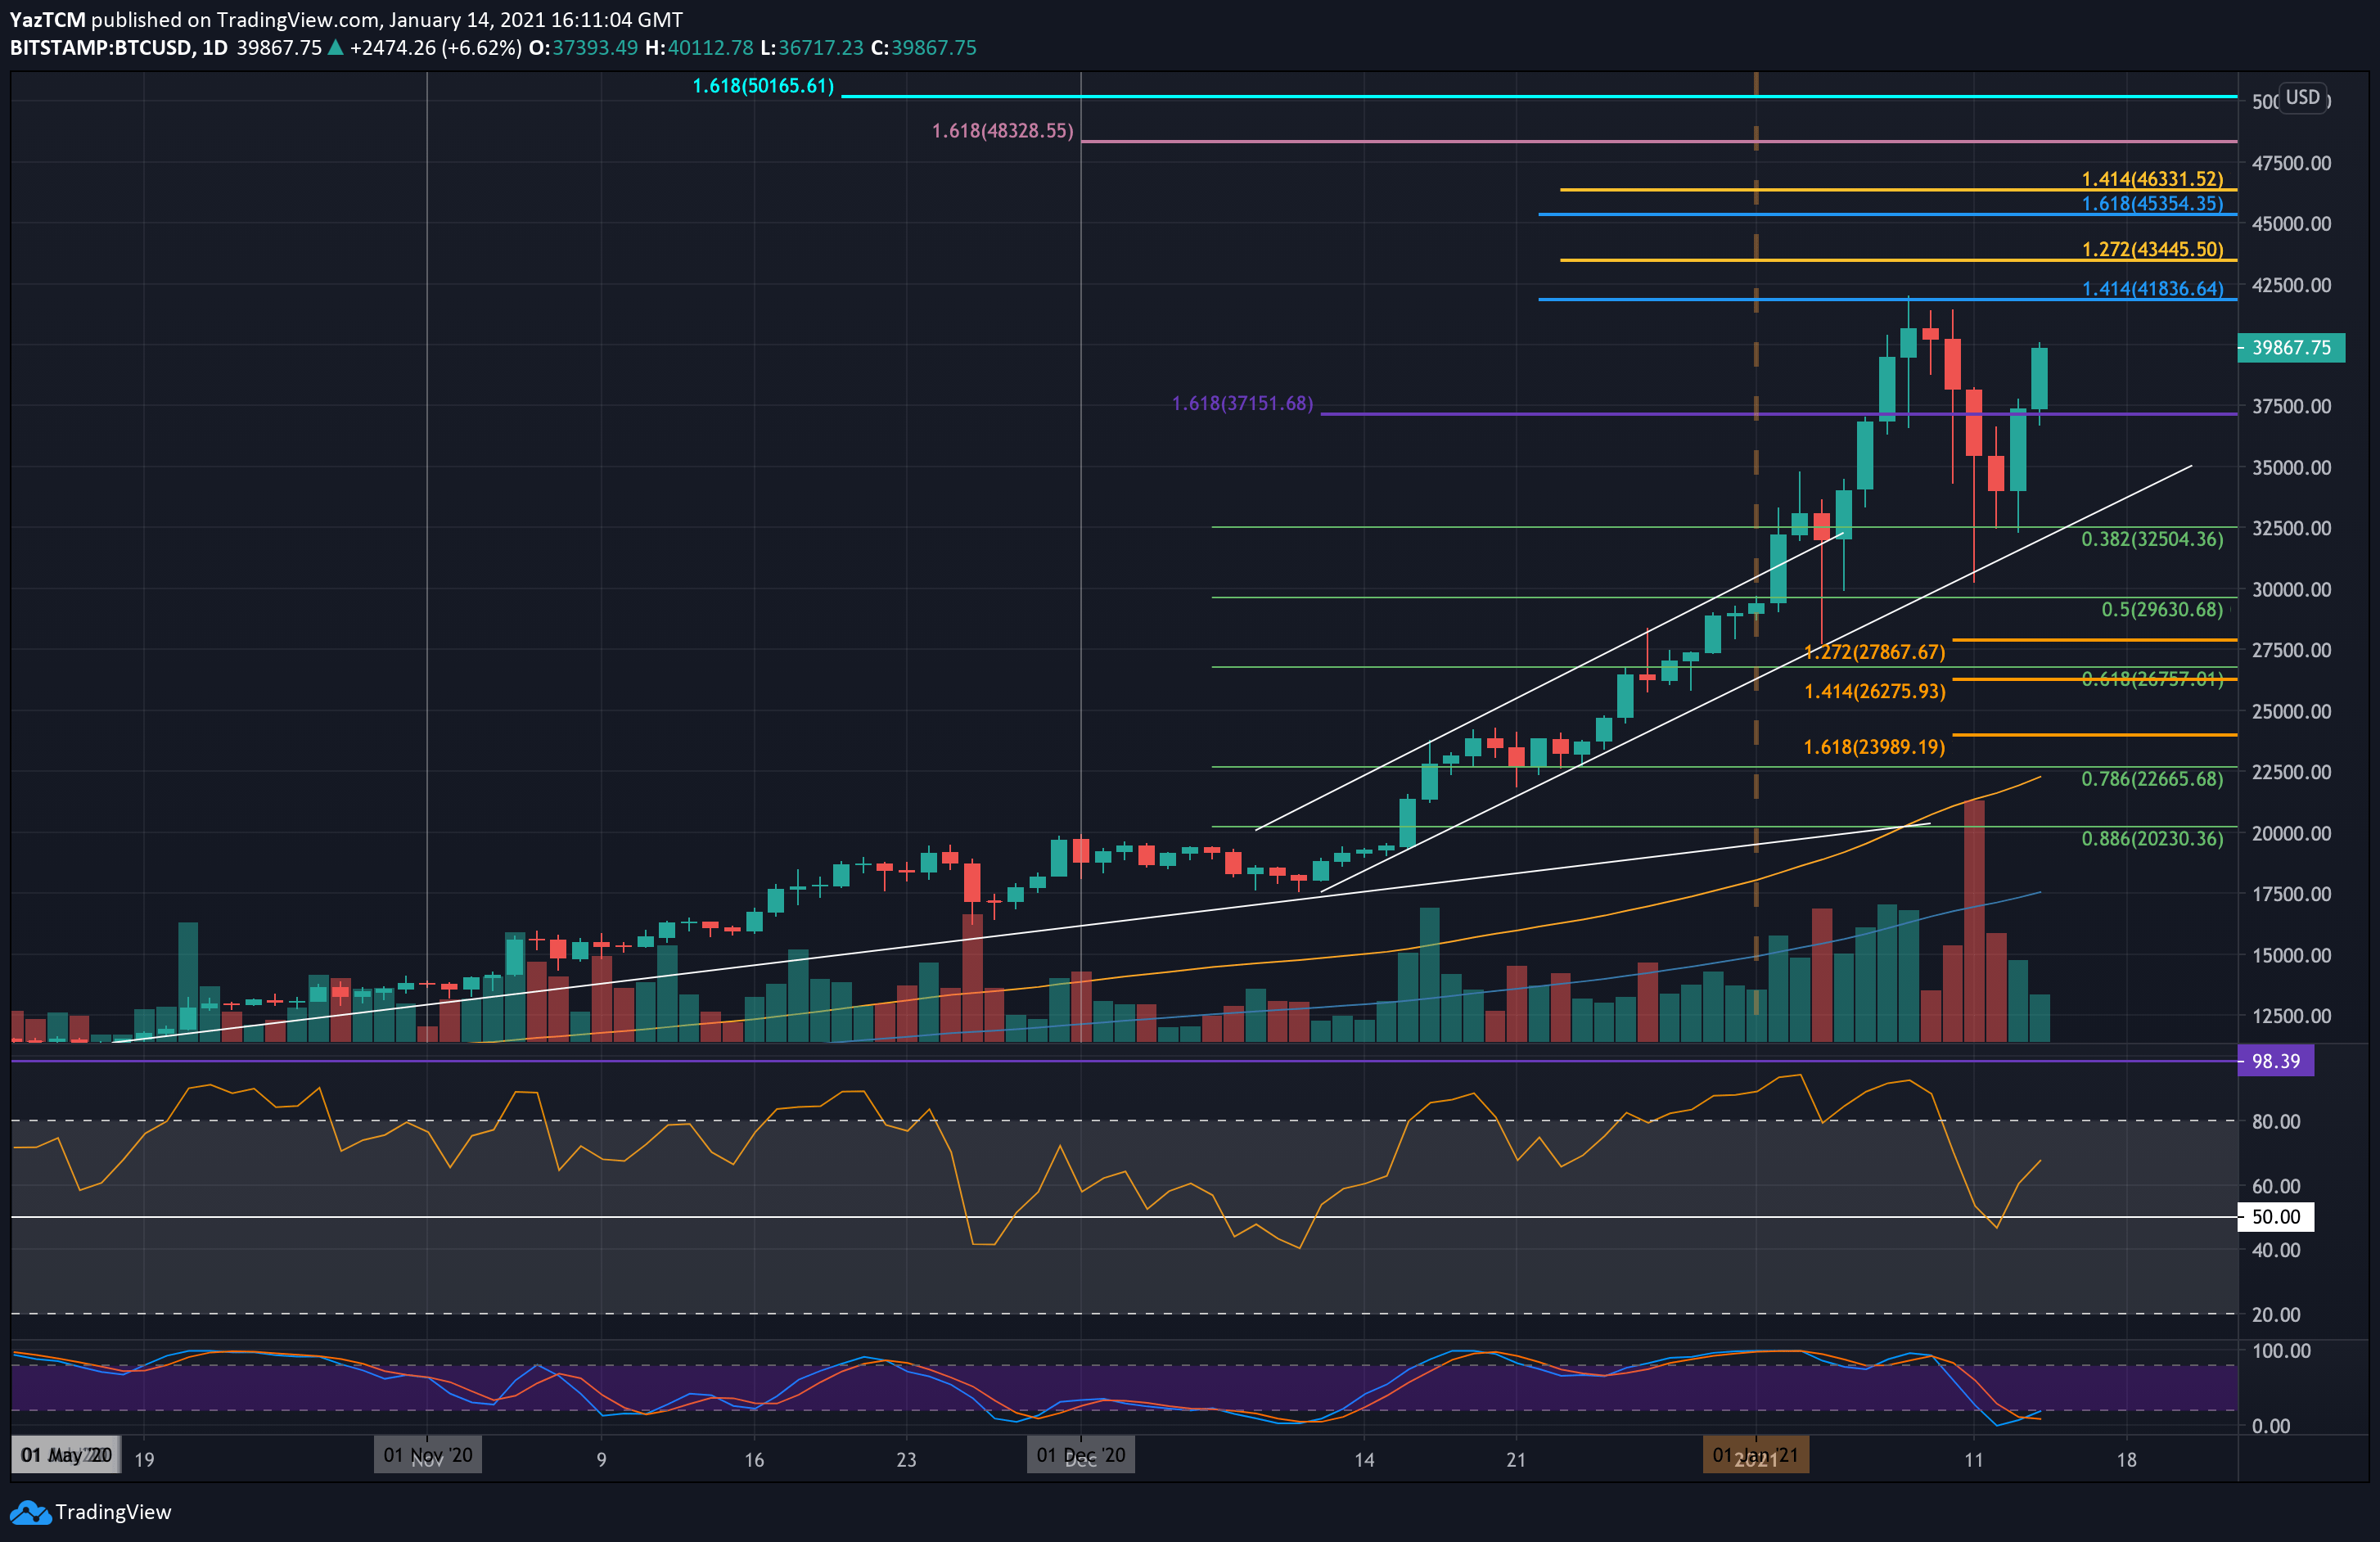
BTC/USD Daily Chart. Source: TradingView
The bulls are back in town with a solid 15% daily price surge, as BTC reclaims the $40K price area. Only two days ago, after reaching $42K ATH, the primary cryptocurrency dropped by a steep 30% to find support upon the $30K level.
The correction was even quicker than the drop as BTC had gained $5,000 only yesterday and closed the daily candle at $37,415 (Bitstamp). Today, Bitcoin’s price continued even higher, recording $40,122 as the daily high as of writing these lines.
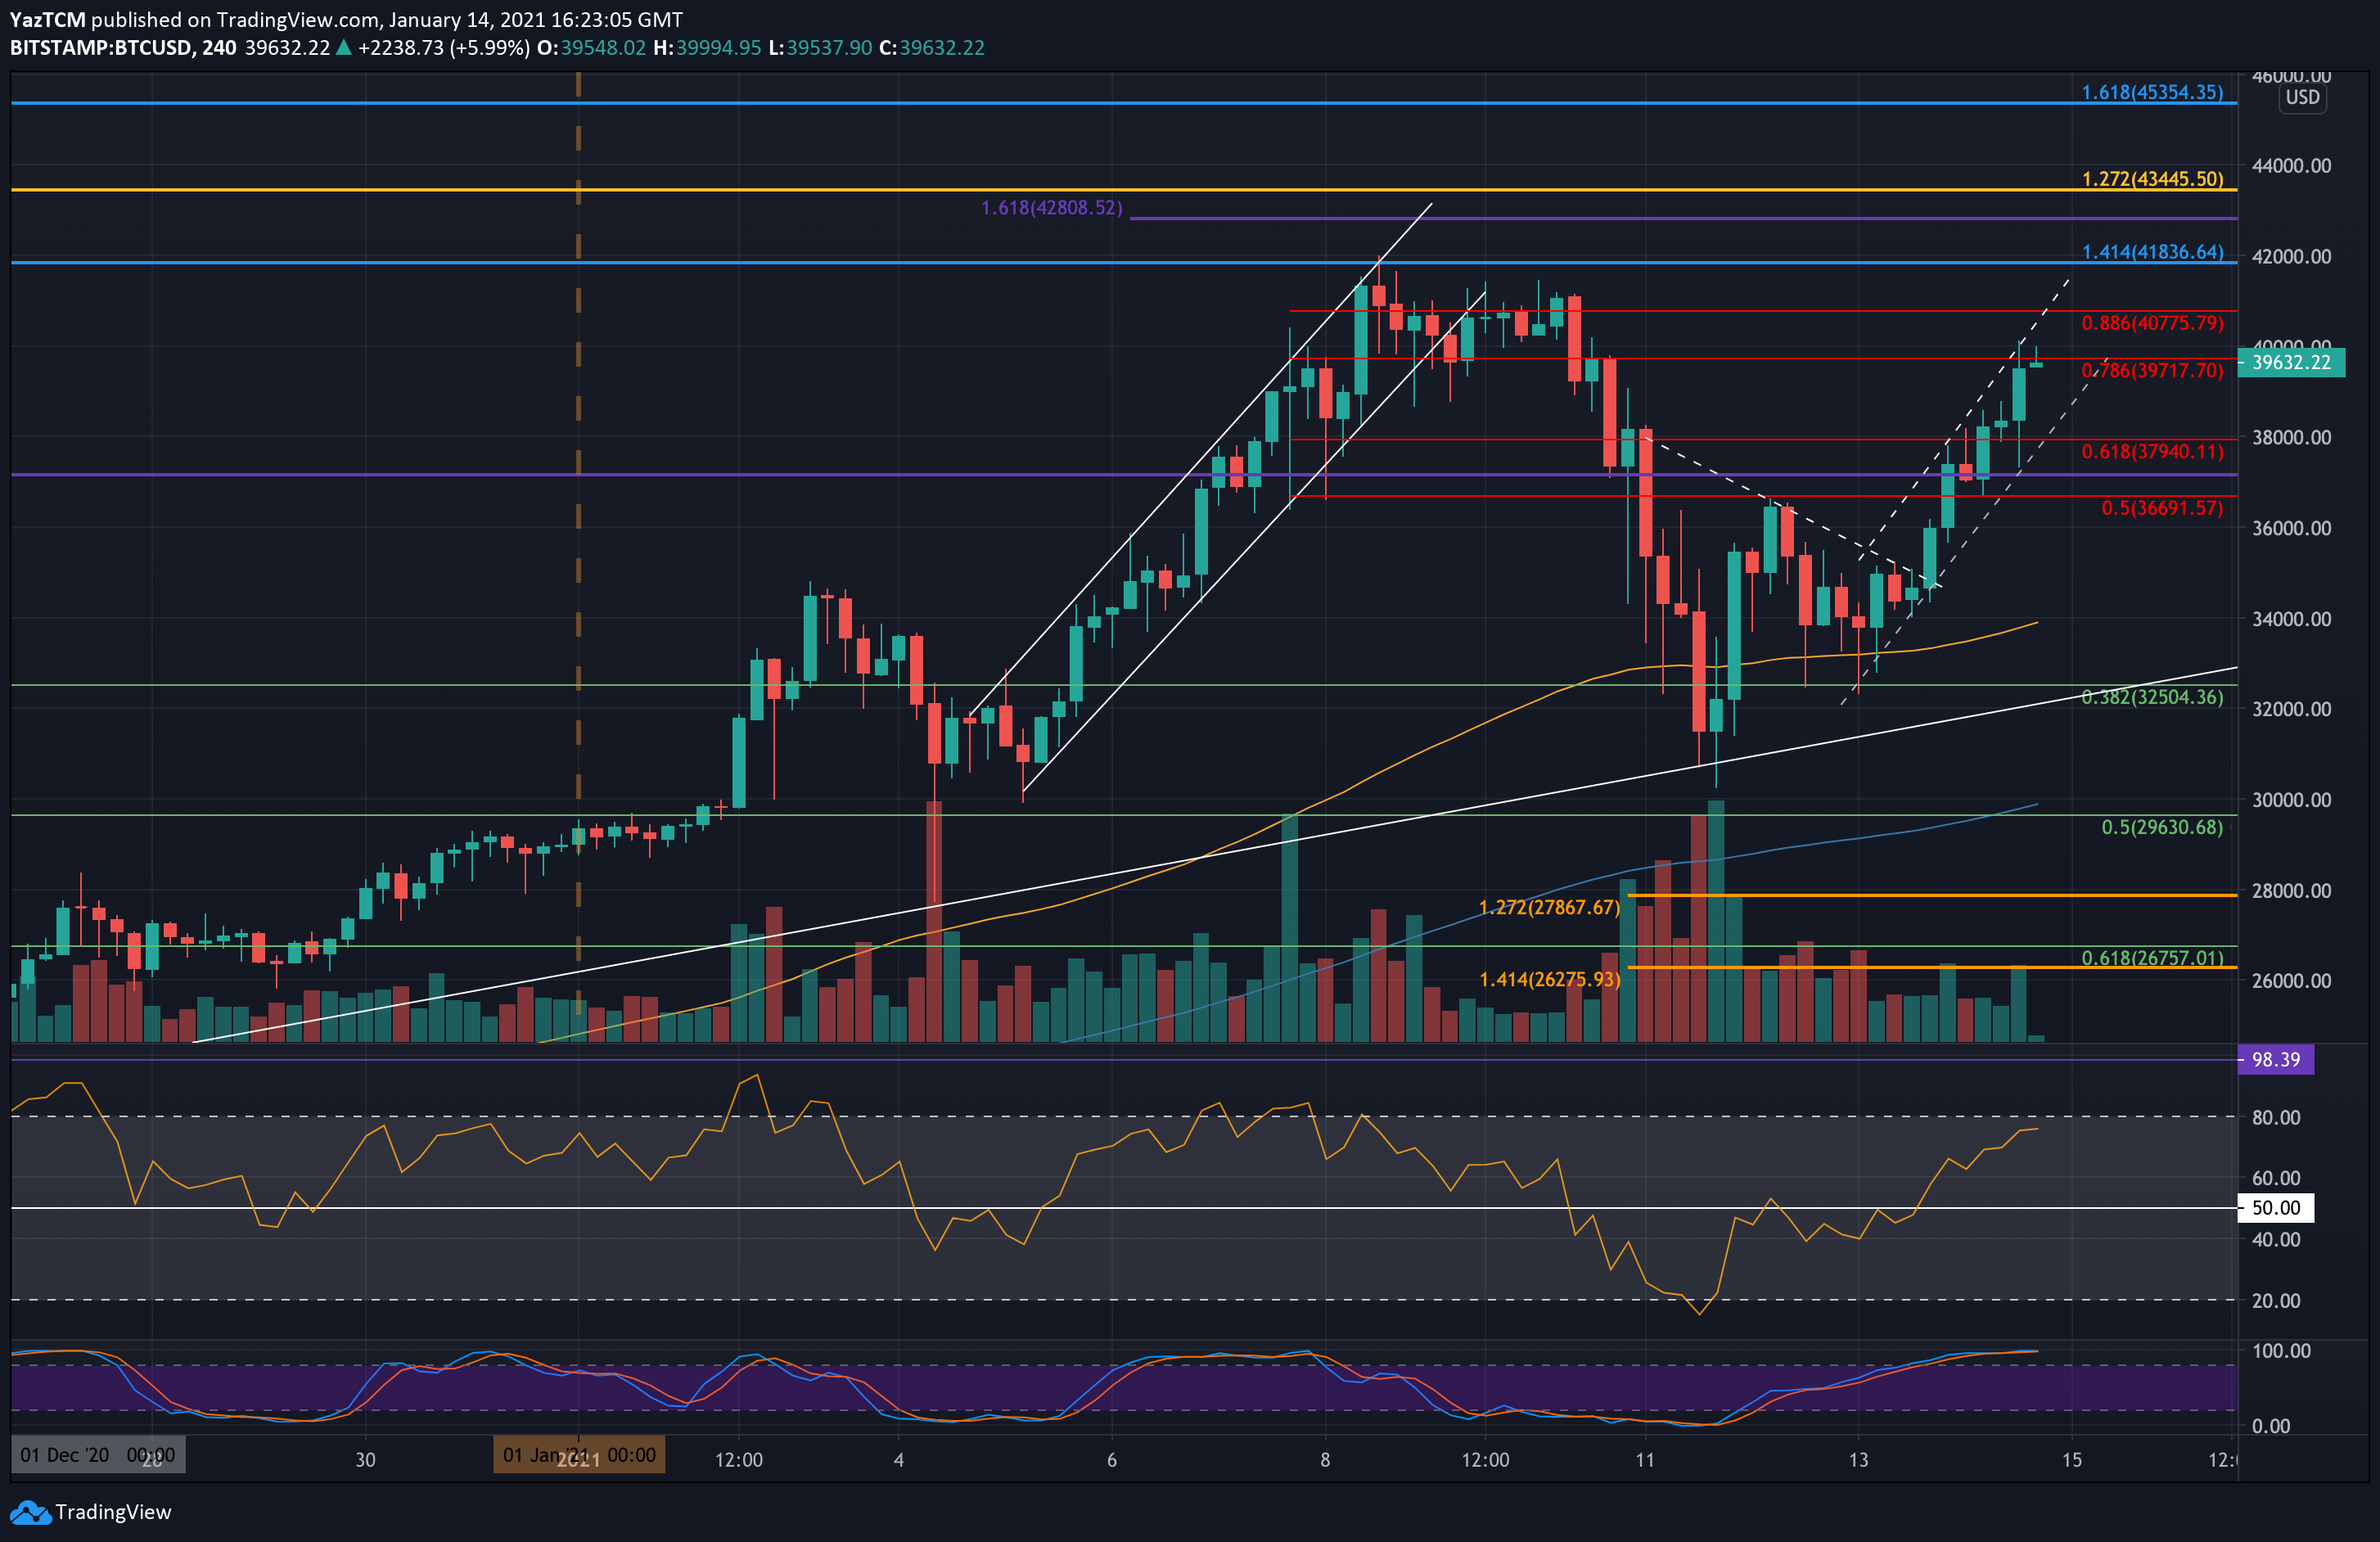
Bitcoin has initiated a new ascending price channel on the following 4-hour chart as it trades around the upper border. Additionally, it has met resistance at a bearish .786 Fib Retracement around $39,720, together with $40 K’s psychological level. Following the 2-day $10,000 rally, it will be interesting to see whether BTC will continue to a new ATH beyond $42K or create a lower low on its way down.
Key Support Levels: $38,000, $37,150, $36,000, $34,000, $32,500.
Key Resistance Levels: $39,720-$40,000, $40,775, $41,000, $41,835, $42,000.
Moving forward, the first level of resistance lies at $40,000. This is followed by $40,775 (bearish .886 Fib Retracement), $41,000, $41,835 (1.414 Fib Extension), and the ATH price at $42,000. In the above-mentioned price are we can also see high chunks of supply of leftover sell commands of traders not selling amid the recent drop.
In case Bitcoin breaks the current ATH at $42K, then the next resistance levels are expected at $43,445 and $45,000.
Alternatively, in case the $40K top from earlier today would turn to be a local top, the first level of support lies at $38,000. This is followed by $37,150, $36,000, and $34,000. Further support lies at the ascending trend line, and $32,500 (.382 Fib).
Following the reversal, the daily RSI recently bounced from the mid-line to indicate that the bullish momentum is increasing once again. The drop toward the mid-line provided an opportunity for the momentum to settle from extremely overbought levels before a possible retest of the ATH zone.