So much for ‘this is the last time you’ll see Bitcoin under five figures”.
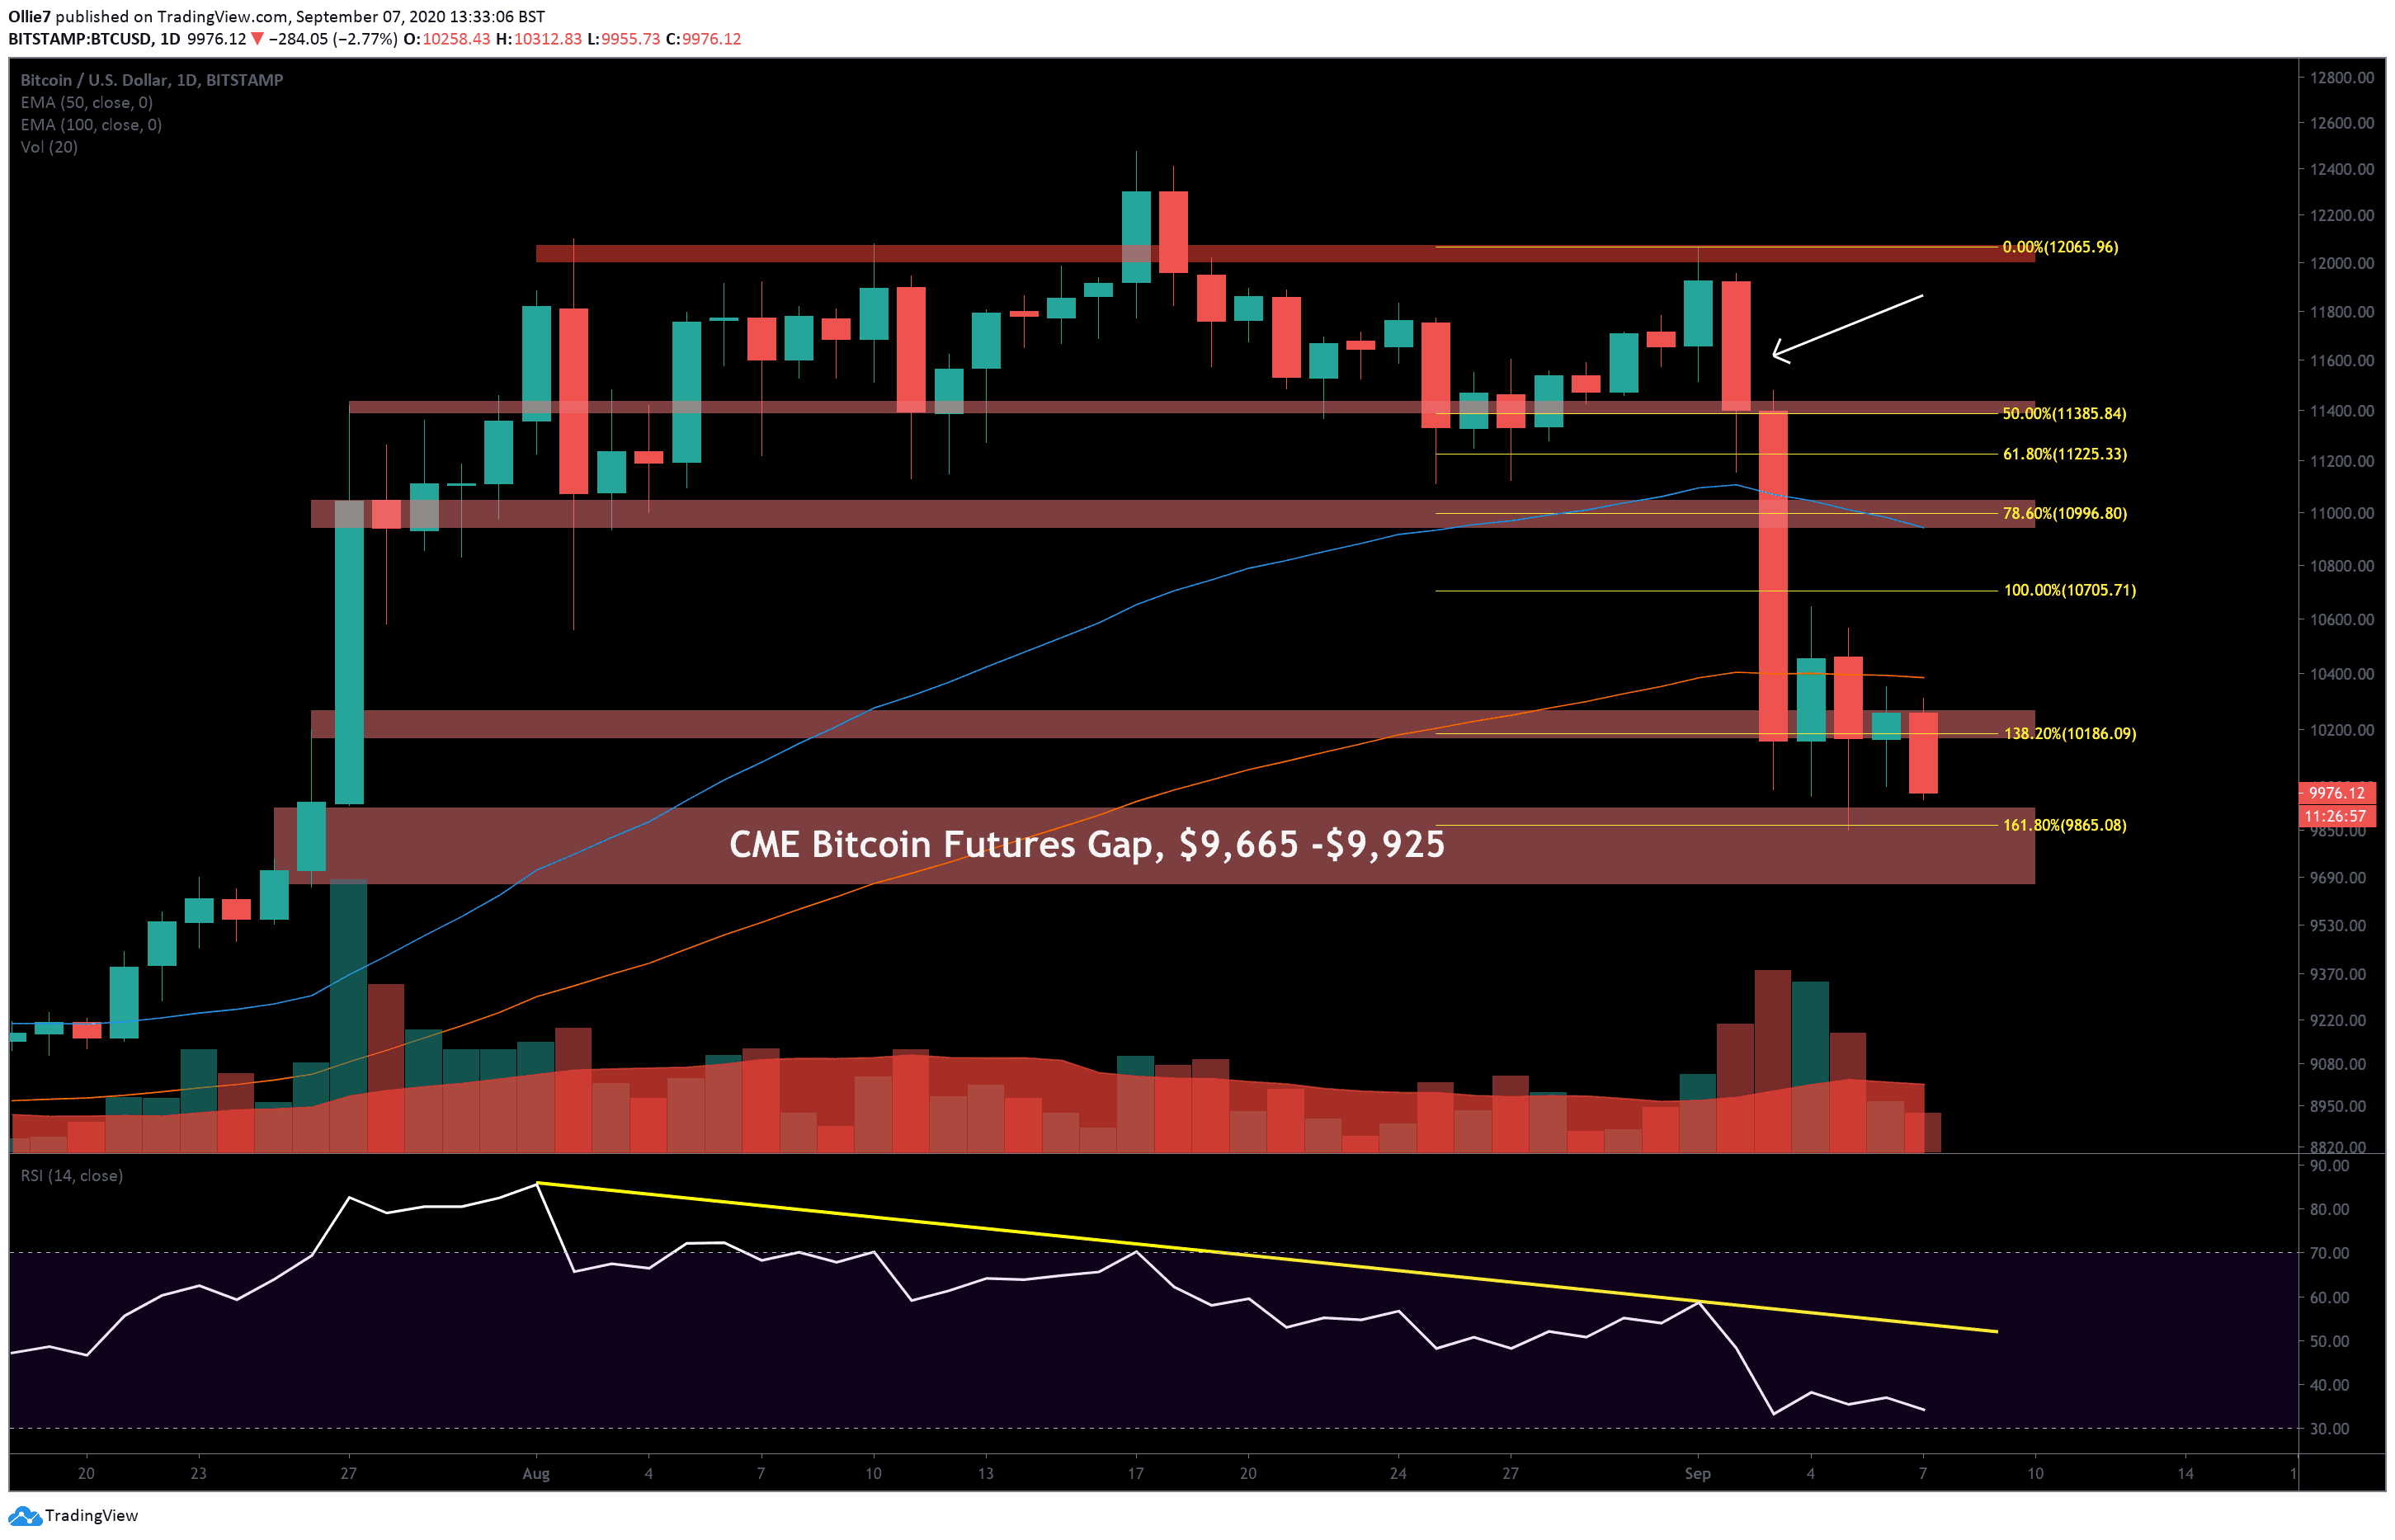
Bitcoin price is now hovering along the top of the unfilled CME gap at $9,925, and looking very likely that it will break down to $9,665 soon to close it off. This anticipation of more downside in the short-term has been reflected by the global crypto market capital, which has fallen by a further $15 billion in the last 24 hours.
It is hoped, however, that once the gap is filled, there will be nothing holding back the #1 crypto asset from restarting its climb back towards setting a new YTD-high.
On the daily BTC/USD chart, we can see that the primary support (1.318 Fibonacci extension level) at $10,180, which propped up Bitcoin over the last four days, gave way during the Asian trading session today.
Now, bullish traders are attempting to regain the psychological $10,000 level as a support, while bears continue to drive towards the $9,665 CME gap target.
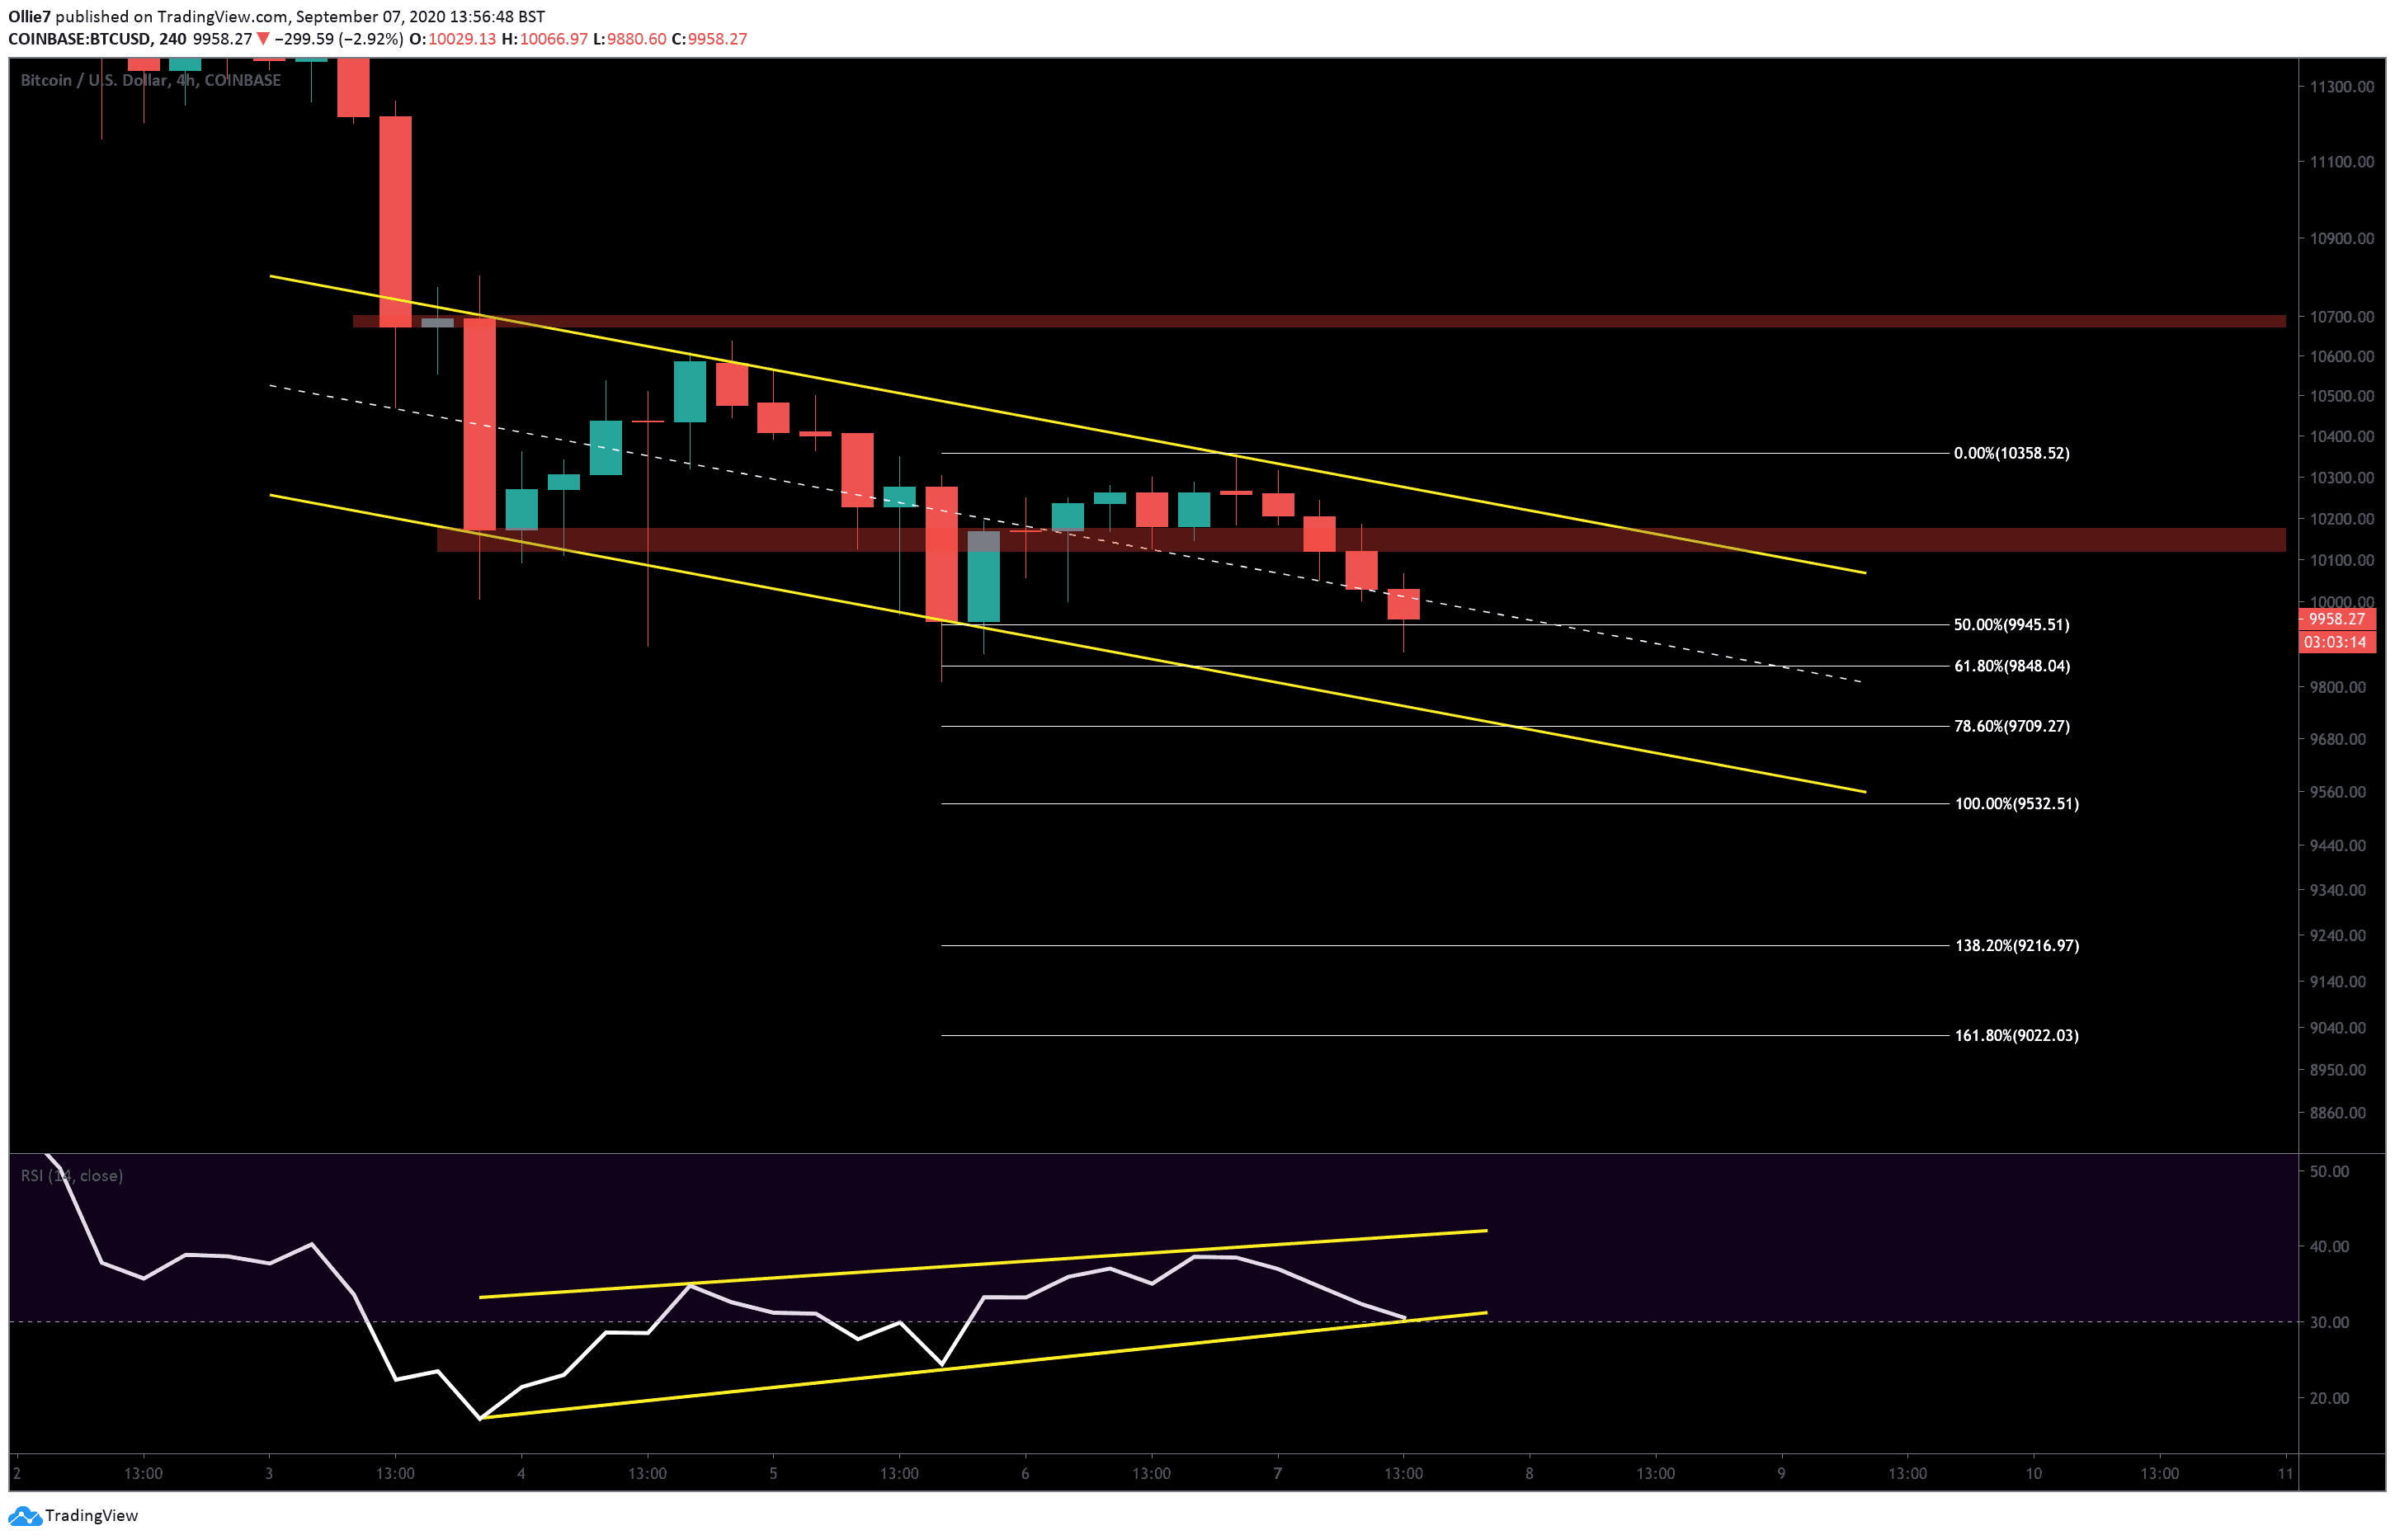
Looking at the 4-hour chart, it’s clear that the current price action is tracking inside a downtrending channel, with two strong resistance areas above. The first zone sits between the $10,170 and $10,120 levels (first red area), followed by an order block resistance further up between the $10,670 and $10,700 levels (second red area).
The $10,700 level also overlaps with the 1.0 Fibonacci extension level, which should make that particular area even more difficult to break above.
On the daily chart, the 100 EMA (red) – which currently sits at $10,385 – could also create some friction if Bitcoin reverses.
Looking further down, we can see 4-hour Fibonacci extension supports are projected at $9,945, $9,848, $9,532, $9,216, and $9,022 if BTC crashes further after filling the gap.
Over this timeframe, there is a reasonably promising RSI divergence, which suggests short-term buying momentum is gaining strength (yellow). While BTC price has been making consistently lower lows, the RSI indicator line has printed two notable higher lows and re-entered back into the channel from the oversold region.
This tends to foreshadow a trend reversal, but we’ll need to wait until more volume arrives before it plays out.
Total market capital: $325 billion
Bitcoin market capital: $185 billion
Bitcoin dominance: 57.0%
*Data by Coingecko