Since around April 2018, Bitcoin had been forming a bearish triangle, with a bottom around $5700 – $5800. Such triangles are very likely to break down. There is less chance that they will break up. But as 2018 months went on, and Bitcoin was attempting to break down the triangle four times, we warned just yesterday (BTC was ~$6200) that “the more times they are tested, support levels get weaken over time and will break at last.”
So after more than two months, where Bitcoin had been traded at the tight range of $6200 – $6800 with very low trading volume, it finally happened, and once the range was breached down, it was a matter of hours to break down 2018 yearly low.
As expected and mentioned several times (our price analysis from August 14): “Breaking down the $5700 – $5800 zone, will likely to create a massive washout to the $5000 – $5300 support area.” The current low lies at $5324 Bitstamp.
Yesterday before the complete mess, we’ve published a bigger picture prediction. The bottom line is that Bitcoin will need to re-test lower numbers in order to turn back to being bullish.
And what about the cause? It might be related to the miner groups hash wars, but it was just about finding a trigger. The smell of a breakdown was here all the time.
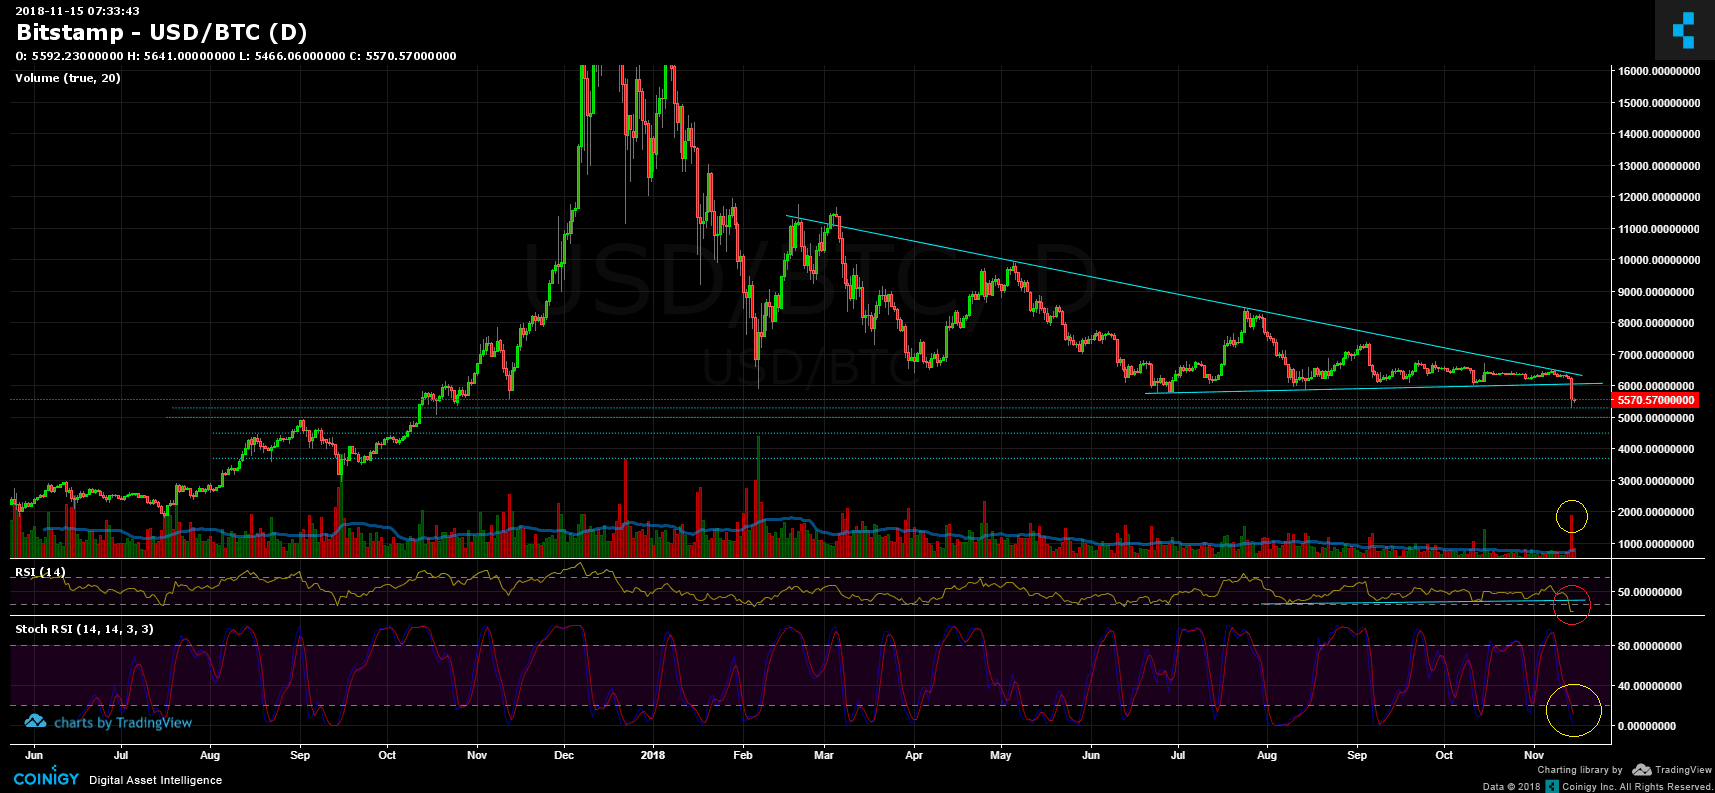
BTC/USD BitStamp 1 Day chart
- Let’s start with the bigger time-frame, the Bitcoin daily chart: As mentioned above, the first target had been reached very quickly at $5300. The $5000 – $5300 might hold as possible support.
- Looking at the critical levels from 2017 – the next major support areas lie at $5000, $4500 and $3700. As we mentioned in the horror prediction – $2700 – $3000 is the possible bottom.
- Resistance levels lie at $5650 (Fibonacci retracement level %38.2), and $5700 – $5800 area which is now support turned tough resistance. The next significant resistance lies at another support turned tough resistance – $6K.
- The RSI indicator: The Relative Strength Index of the daily chart was mentioned in our yesterday’s price analysis. As can be seen in the above chart (marked by a red circle), the significant support line didn’t hold.
- Scholastic RSI oscillator is at its bottom levels. So far, visiting those levels carried out a correction up.
- After two months of death volume, the daily volume is the highest since April 25. And as we all know, the sellers have the lead.
- BitFinex open short positions surged from yesterday’s low of 19K positions to 26K open positions. In this case (unlike the Tether crash) we can say by the short positions that there was no inside information.
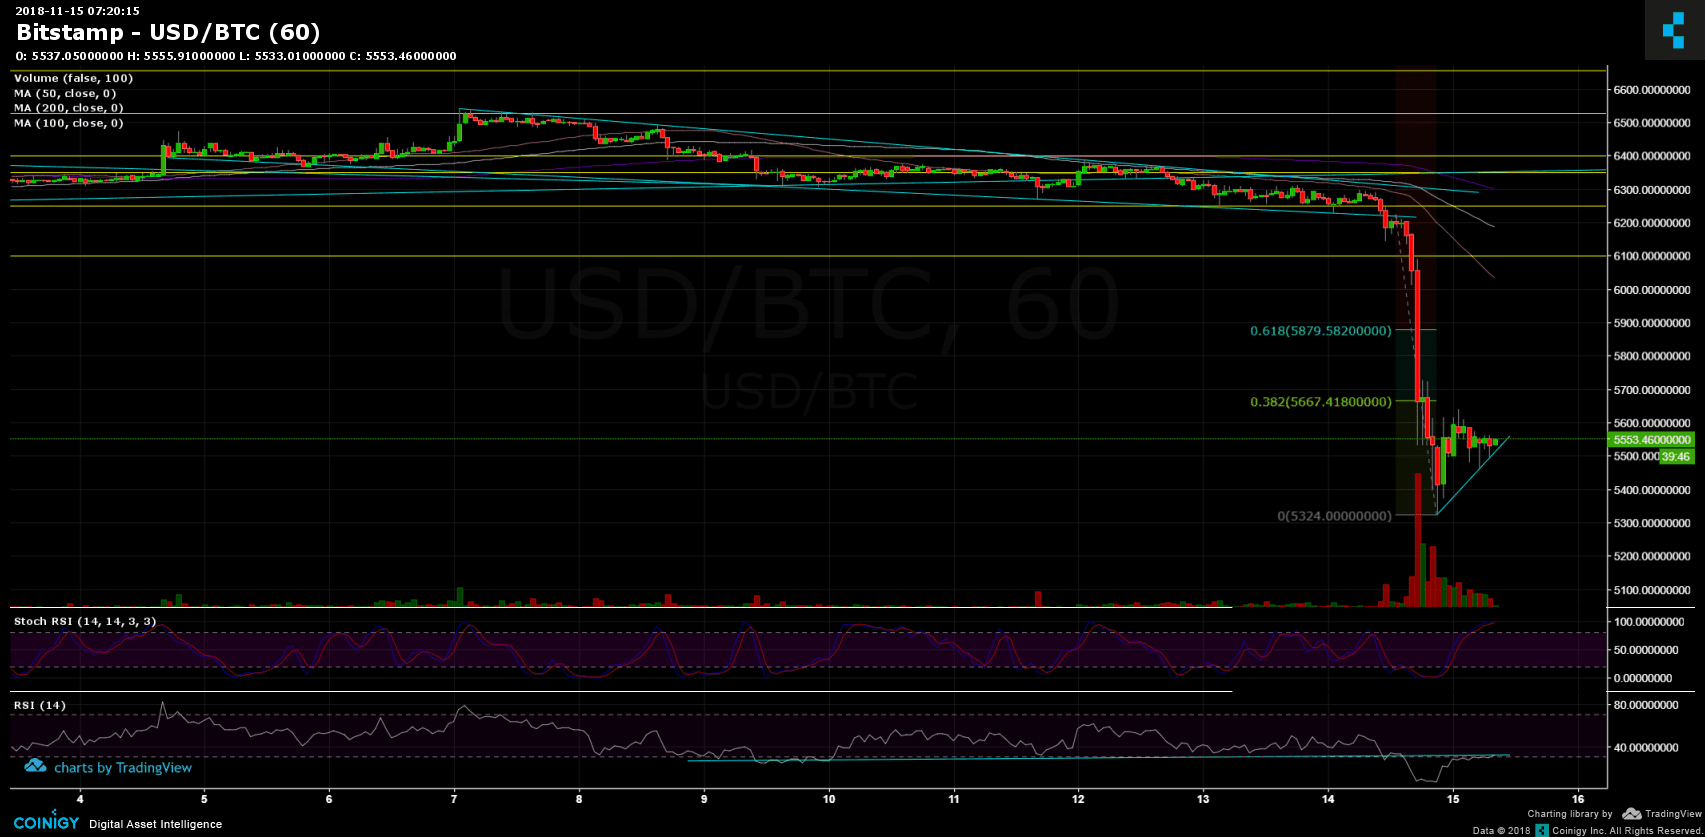
BTC/USD BitStamp 1 Hour chart
- Just to add the above, we can see a mini-trend line forming. As of now, it’s only a correction till the blood continues.
- The RSI indicator is now testing the support turned resistance. The bulls hope that this won’t stop the positive correction.
Cryptocurrency charts by TradingView. Technical analysis tools by Coinigy.
SPECIAL OFFER (Sponsored)
Binance Free $600 (CryptoPotato Exclusive): Use this link to register new account and receive $600 exclusive welcome offer on Binance (
full details).
LIMITED OFFER 2024 for CryptoPotato readers at Bybit: Use this link to register and open a $500 BTC-USDT position on Bybit Exchange for free!
Disclaimer: Information found on CryptoPotato is those of writers quoted. It does not represent the opinions of CryptoPotato on whether to buy, sell, or hold any investments. You are advised to conduct your own research before making any investment decisions. Use provided information at your own risk. See Disclaimer for more information.