After the bulls had been lately suffering, seeing Bitcoin plunging to $7,700, we started to see an opportunity for a price pull-back on our recent price analysis, three days ago.
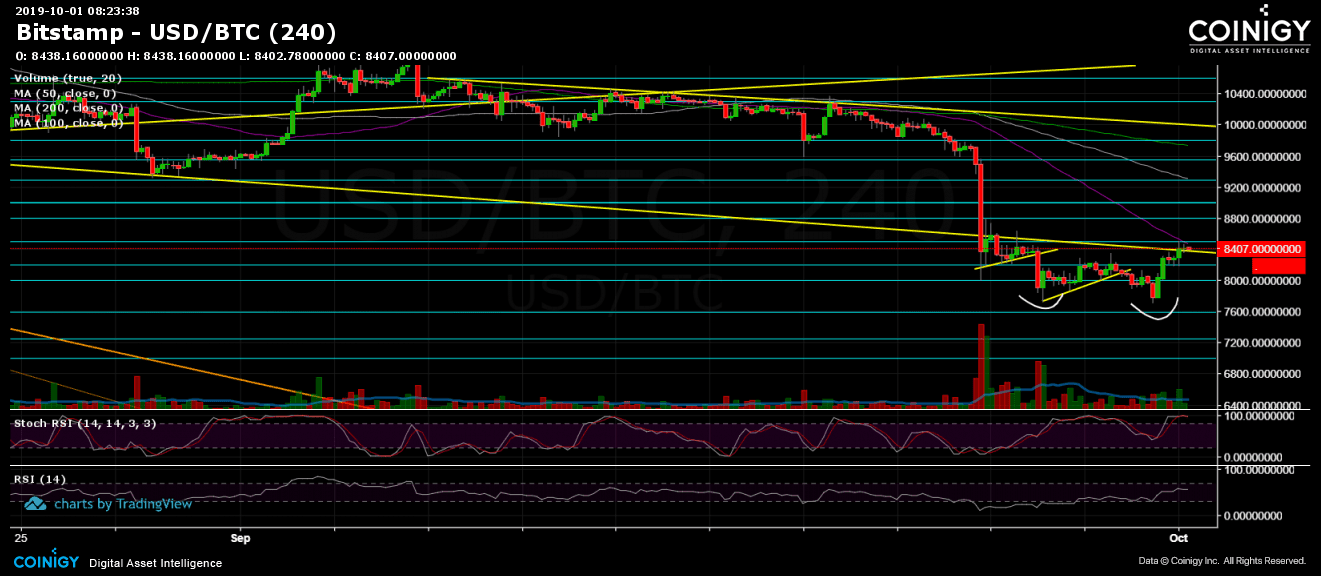
Following a decent daily move of $700 since reaching yesterday’s low, the question is, if that indeed was the real bottom. In short, we could identify a double-bottom formation which is bullish and can support the idea of bottoming.
However, to confirm that, Bitcoin will have to show some more bullish evidence. As of writing this, the coin is facing the significant 200-days moving average line for the second time (as resistance), after getting rejected once two days ago. A daily close above the moving average line is necessary in order to continue further above.
Total Market Cap: $224 billion
Bitcoin Market Cap: $151 billion
BTC Dominance Index: 67.6%
*Data by CoinGecko
– Support/Resistance:
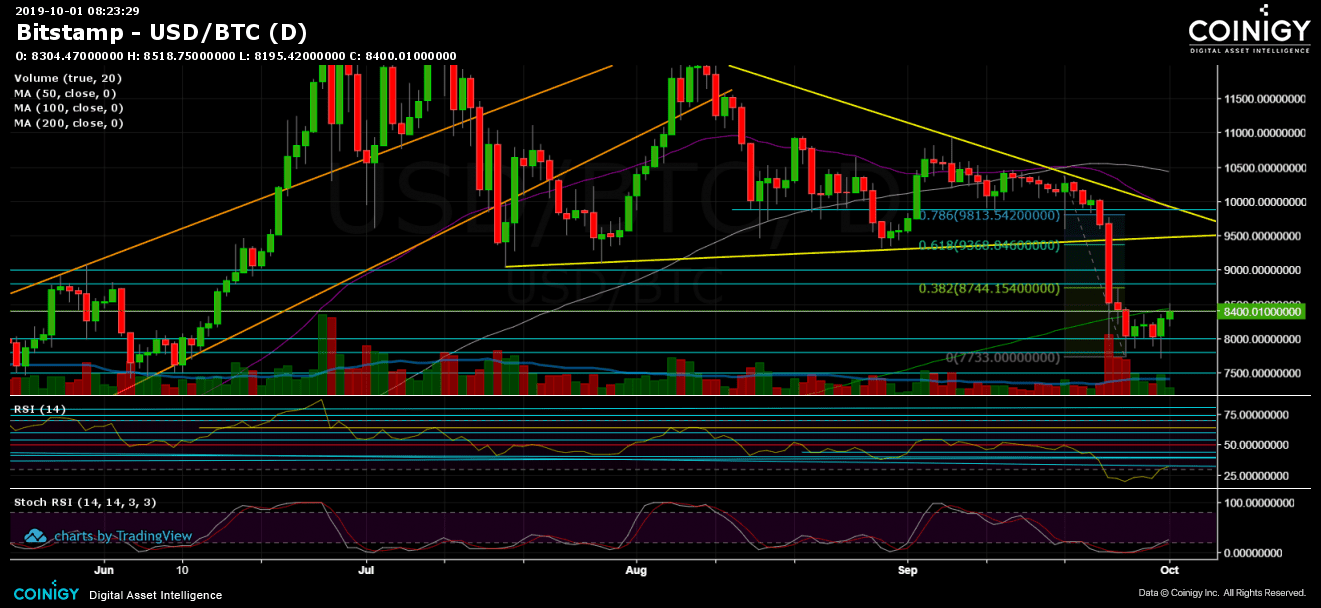
As mentioned, Bitcoin is now encountering the MA-200 (marked in light green), currently sitting around $8,450. Further above is $8,750 – $8,800 resistance area, which contains the 38.2% Fibonacci retracement level. The next resistance lies at $9,000, whereas the real test for Bitcoin bulls is located at $9,400 – $9,500 which contains the ascending trend-line (of the famous 2019 bearish triangle which got broken recently, shown on the following daily chart) along with the 61.8% Fibonacci retracement level (the “Golden Fib”).
From the bearish side, the first major support level lies at $8200, before the $8,000 level. From below, the low of September at $7,700 is maybe the most short-term significant support. In case of a breakdown, Bitcoin will likely to quickly see $7,500 and $7200, which is also the Fibonacci level of 61.8% since reaching the 2019 high last June.
– The RSI Indicator (Daily): After reaching overextended RSI areas for the first time since November 2018, the RSI continues its recovery process. As of writing this, the daily RSI is facing the 33-34 support turned resistance area, while a bullish sign might be coming on behalf of the Stochastic RSI oscillator, as the last made a cross-over in the oversold territory and just about to enter the bullish zone. This might grant some more fuel for a deeper positive correction.
– The Trading Volume: over the past week Bitcoin saw an increased amount of volume, however, if the bulls want to get back to the game, they will need their green volume candles to become the dominant ones (high number of buyers).