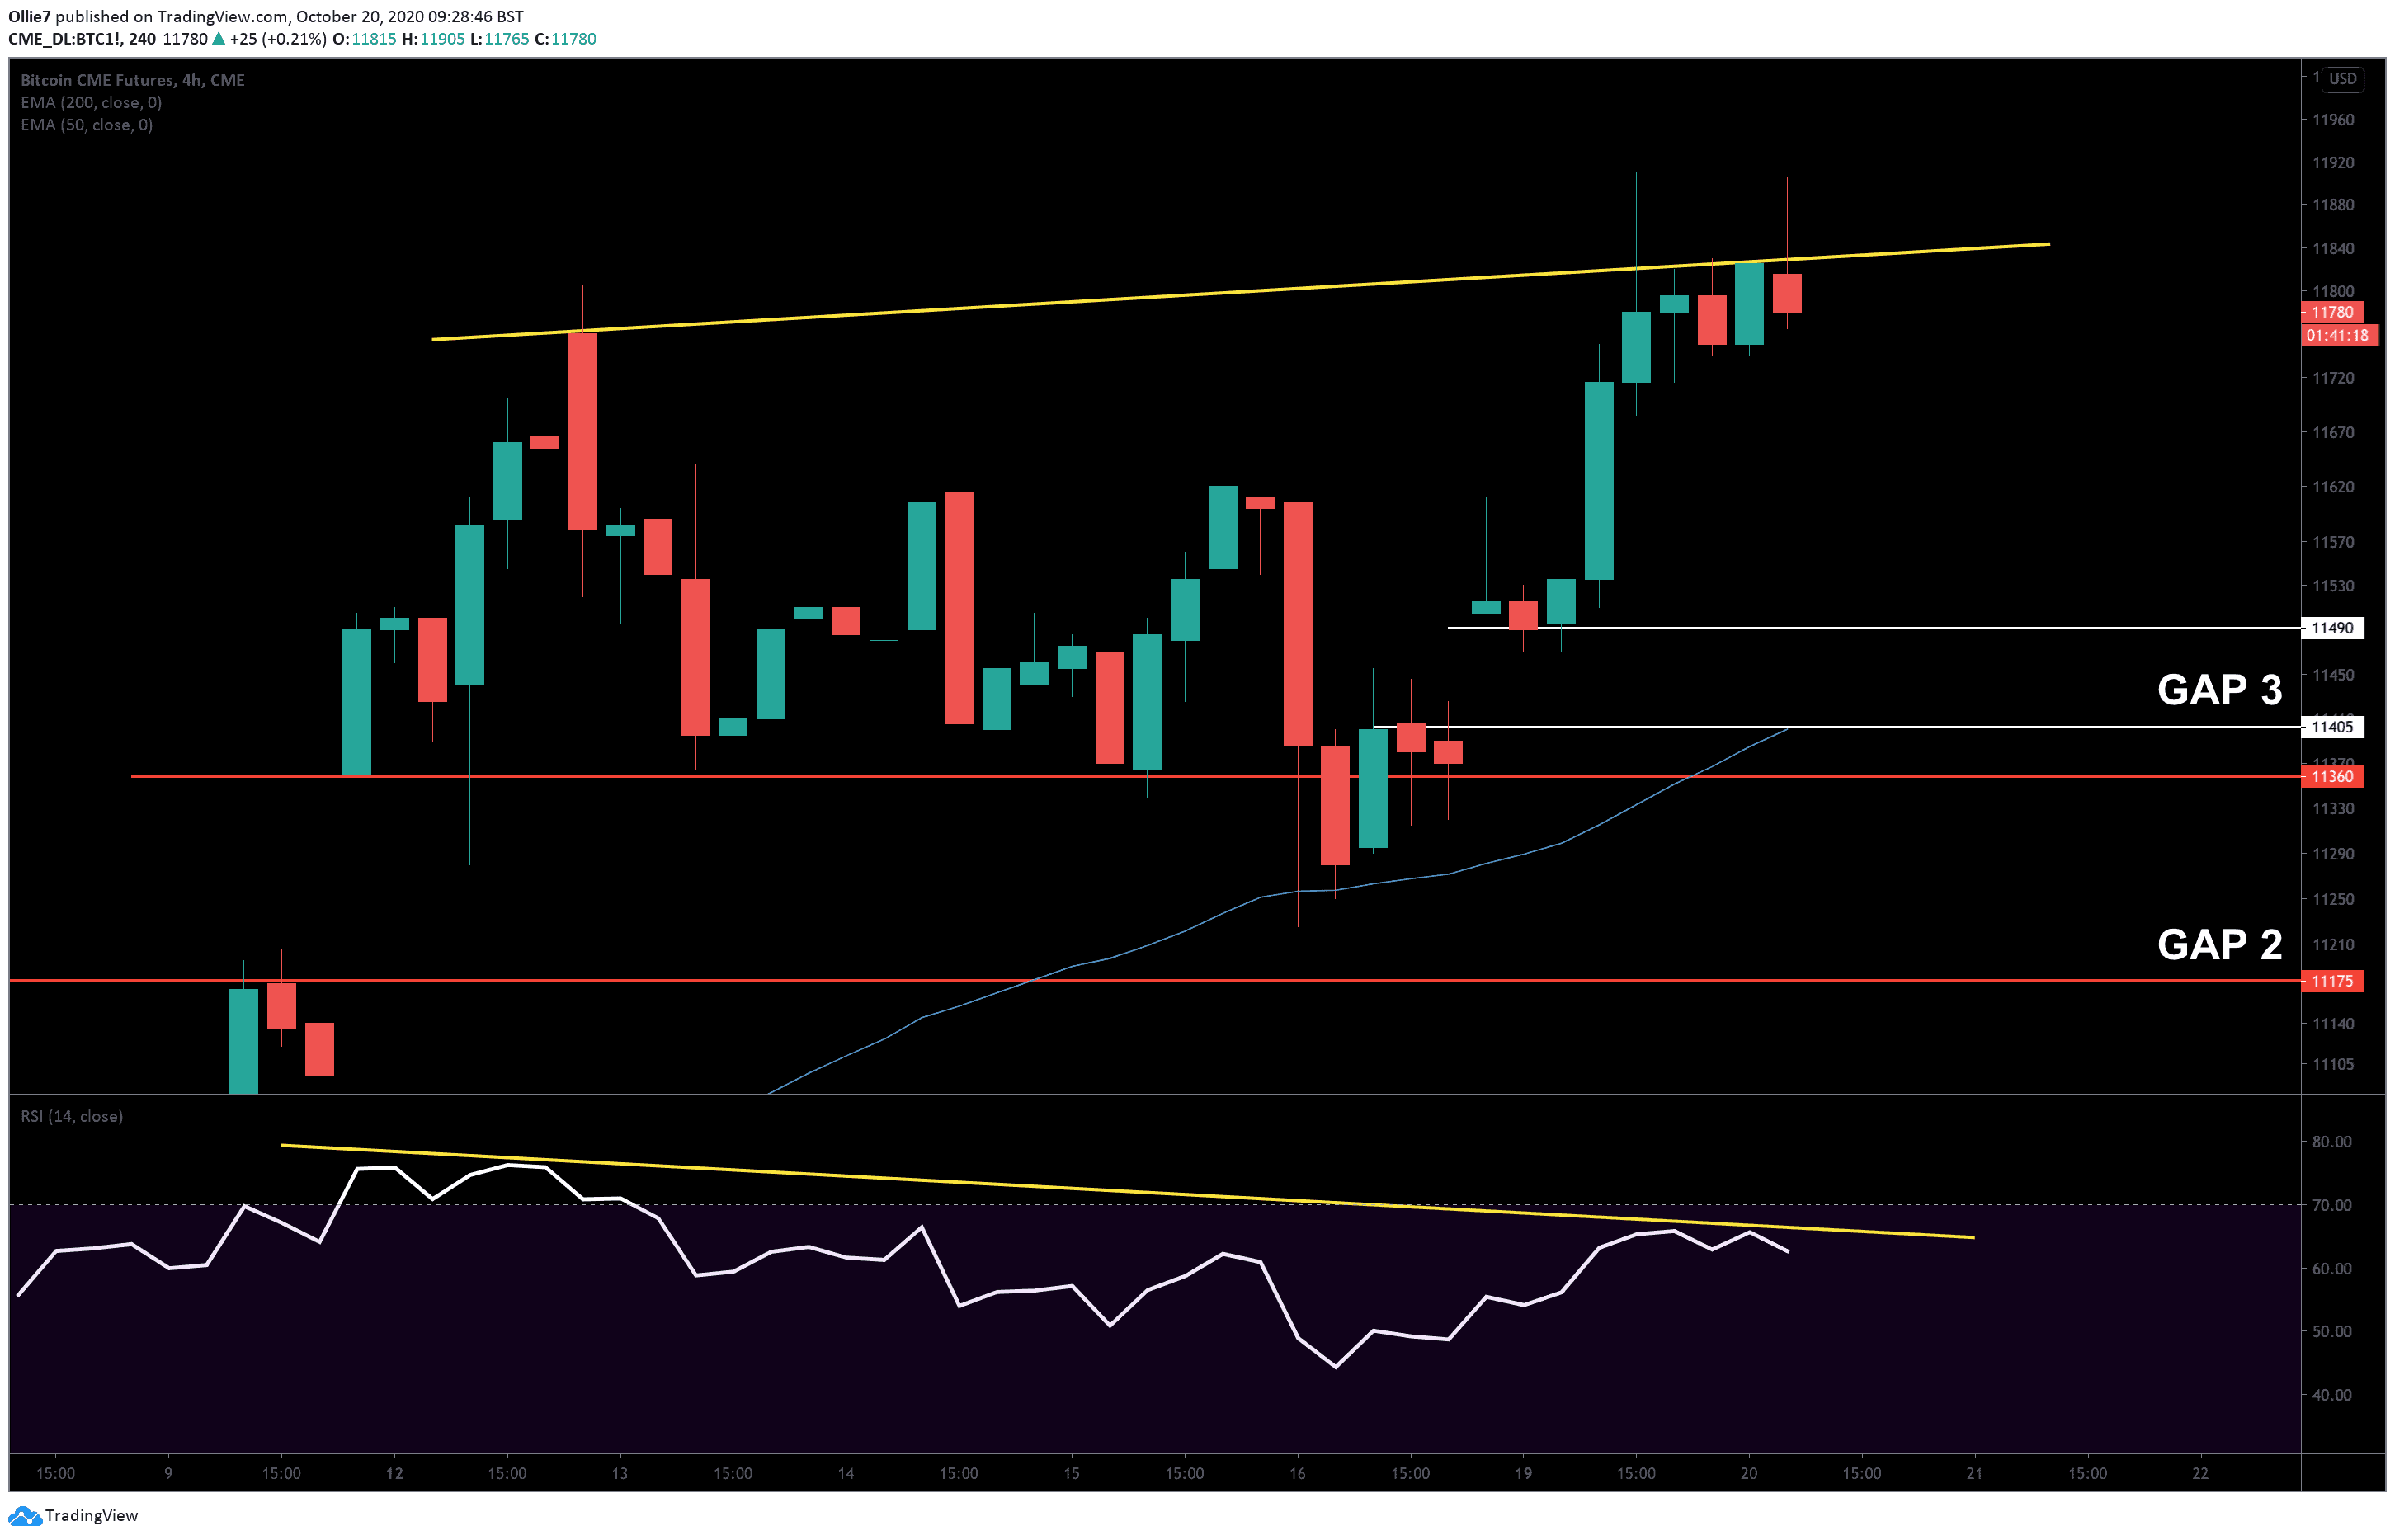
BTC1! chart via Tradingview
Bitcoin price is recovering with yesterday’s surging breakout to $11.8K. The arrival of the new bullish momentum coincided with the US trading markets opening for the week and caused $6 billion to flood back into the crypto space within a few hours.
This sharp rise in trading volume has created a third gap on the CME bitcoin futures chart (GAP 3) between $11,490 and $11,405, which will undoubtedly be adding pressure on top of the current uptrend. Not far beneath it is the second unfilled gap (GAP 2) between $11,360 and $11,175, which could also be filled if bears take control over the bitcoin market.
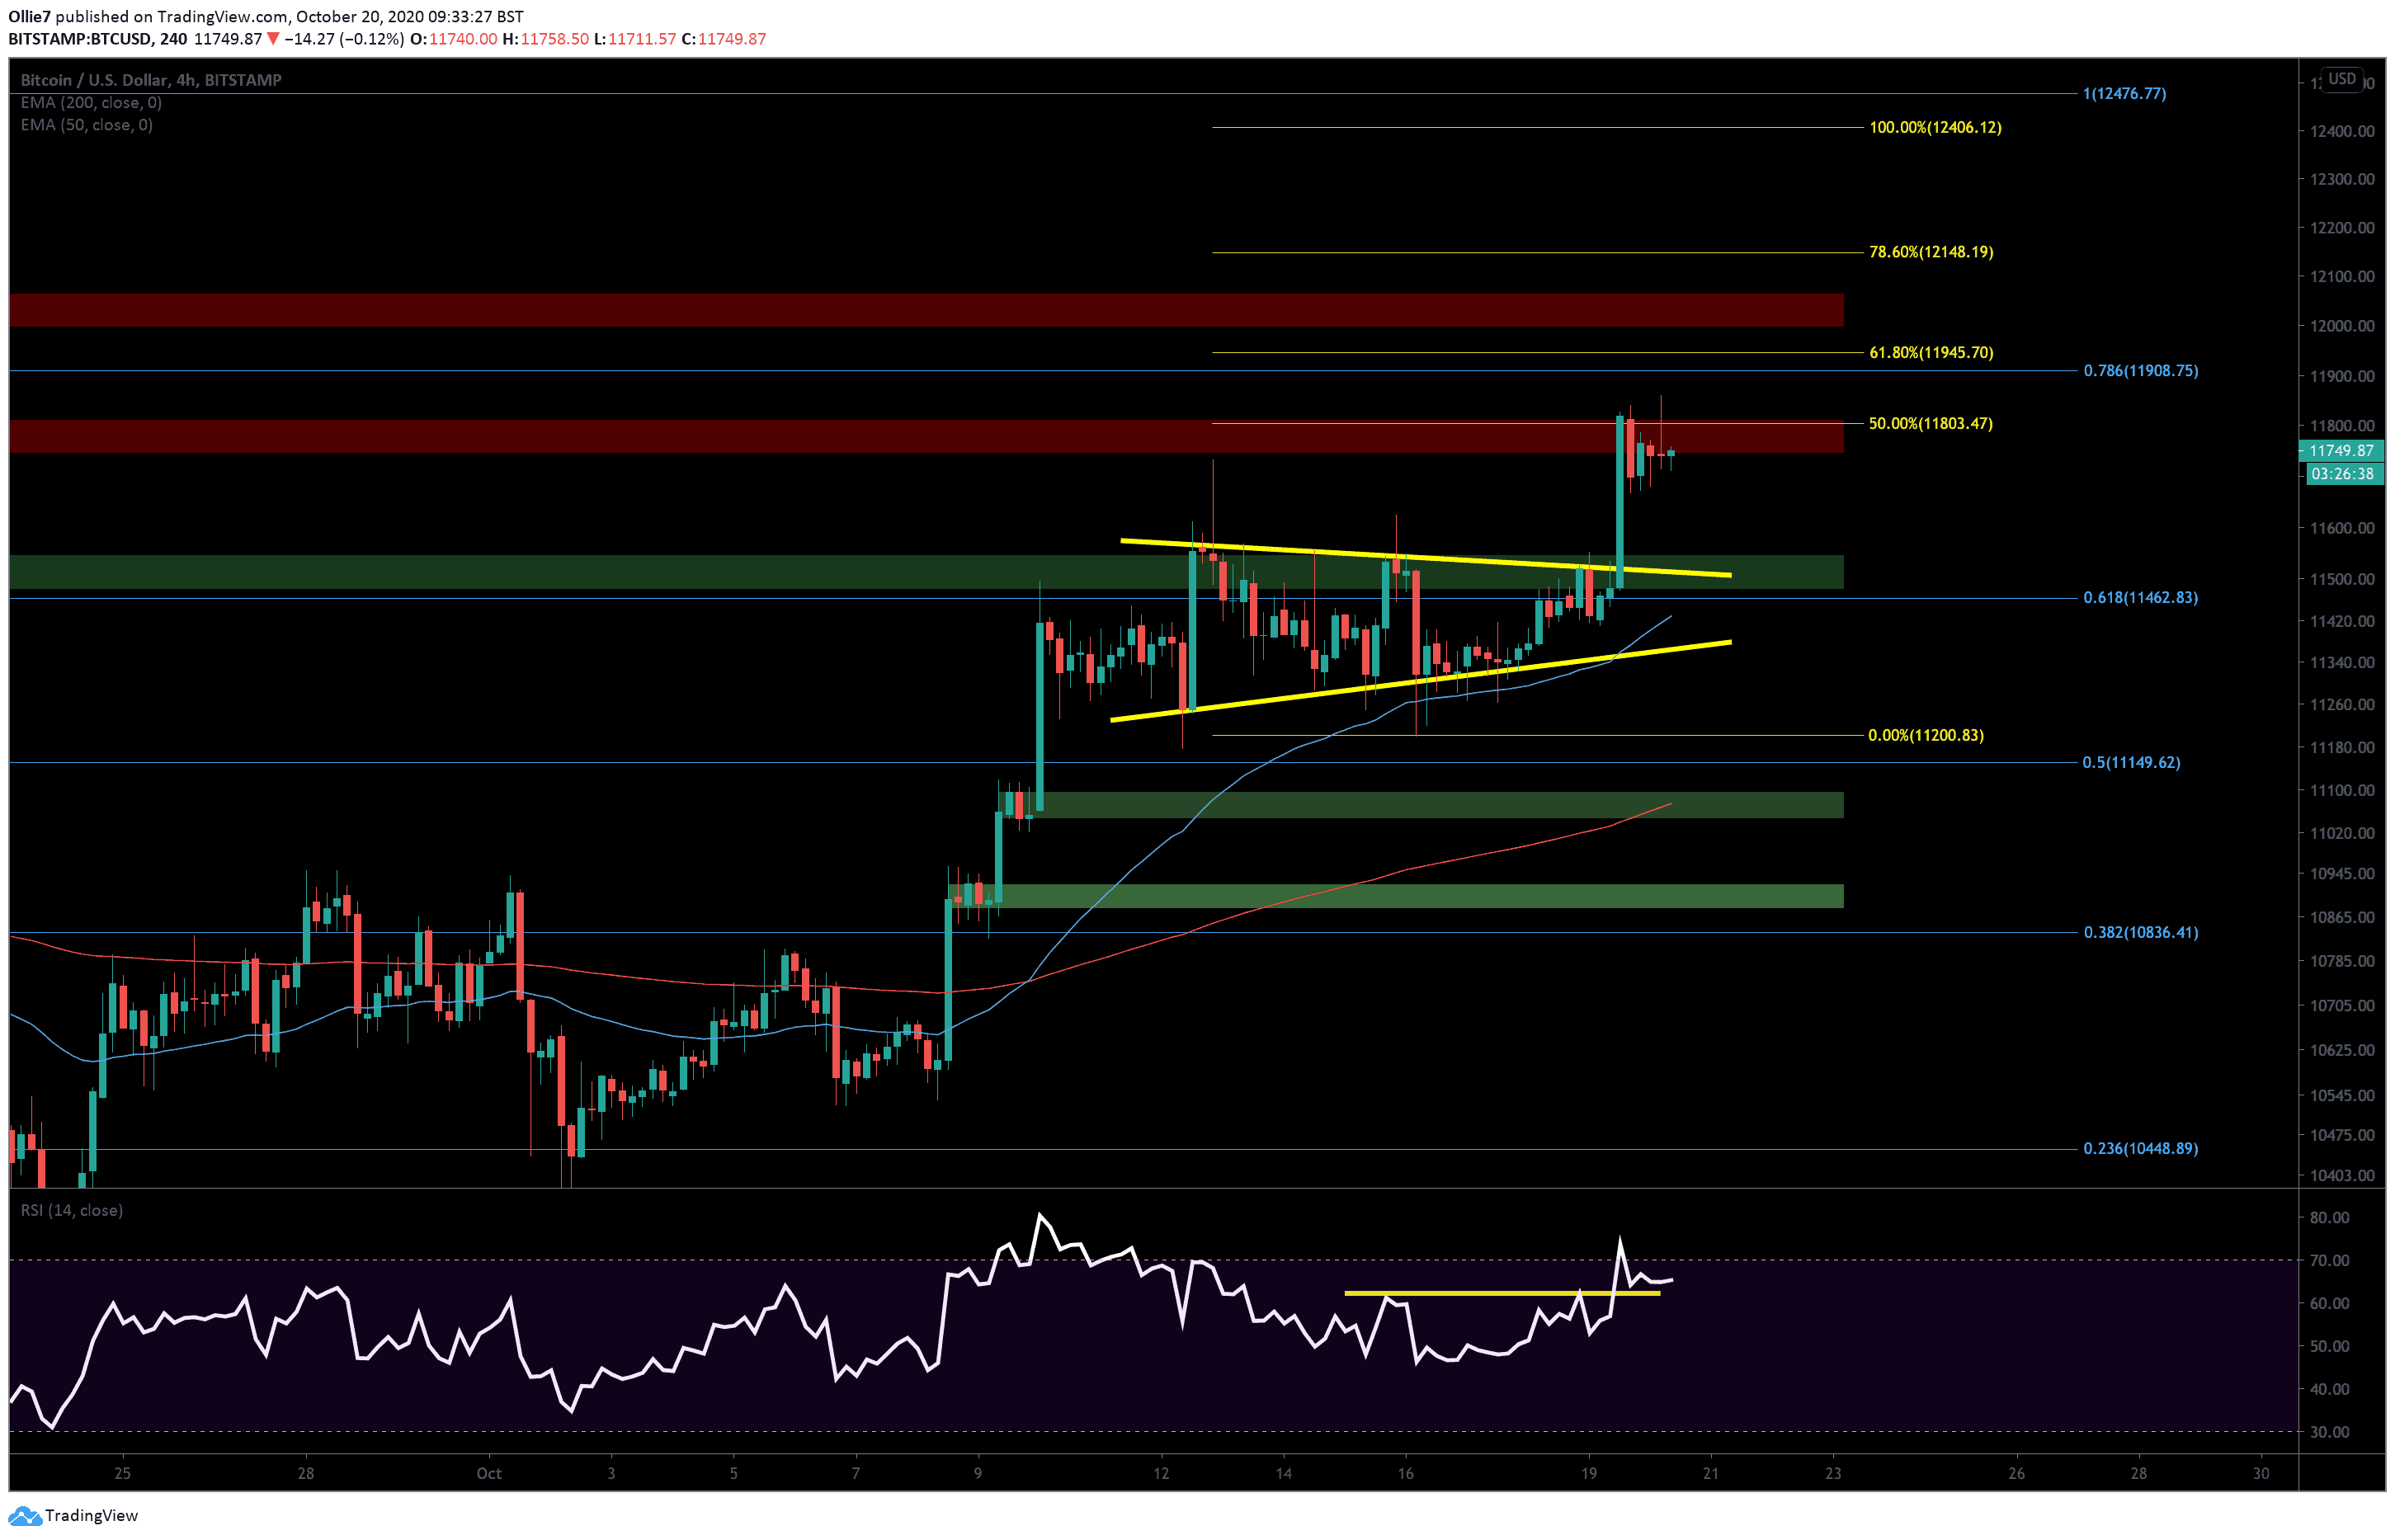
On the 4-hour BTC/USD chart, we can see that the key resistance to break above right now is the $11,800 level. This price point has already pushed back bulls on two separate occasions in the last 48 hours and has been a strong daily resistance level in the past.
On the 1-hour timeframe, the price action does appear to be in the early stages of forming a bullish pennant. However, we still need to see further consolidation before we can confirm this.
If it does turn out to be a bullish pennant and bitcoin breaks to the upside again, then the 0.786 Fibonacci level at $11,908, the 0.618 Fibonacci extension level (yellow) at $11,945, and the primary resistance zone (red shaded area) around $12K will be the first set of likely targets during the new leg of the uptrend.
Further above lies the major resistance area of $12,000 – $12,100. Despite a false breakout, the latter was the upper roof for Bitcoin throughout the month of August.
Next is the $12,500 resistance, which is the current 2020 high recorded on August 17, 2020. Further beyond lies $12,800, before $13,500 and the high from June 2019 at $13,880.
From the other hand, if bulls fail to break above $11,800, however, then the 1-hour 50 EMA at $11,600 and the first main support zone (green shaded area) between $11,540 and $11,480 should provide bulls with a solid footing to throw back from.
From there, we also have the 0.618 Fibonacci level at $11,460 and the 4-hour 50 EMA (blue) at $11,430, which could provide additional support if bitcoin breaks back into its former consolidation pattern.
The RSI divergence on the bitcoin spot market has now resolved, however, there still remains a significant divergence between the RSI and the CME Bitcoin futures price action (yellow line), which suggests derivative buying momentum is waning.
Total market capital: $369 billion
Bitcoin market capital: $217 billion
Bitcoin dominance: 59.0%
*Data by Coingecko.