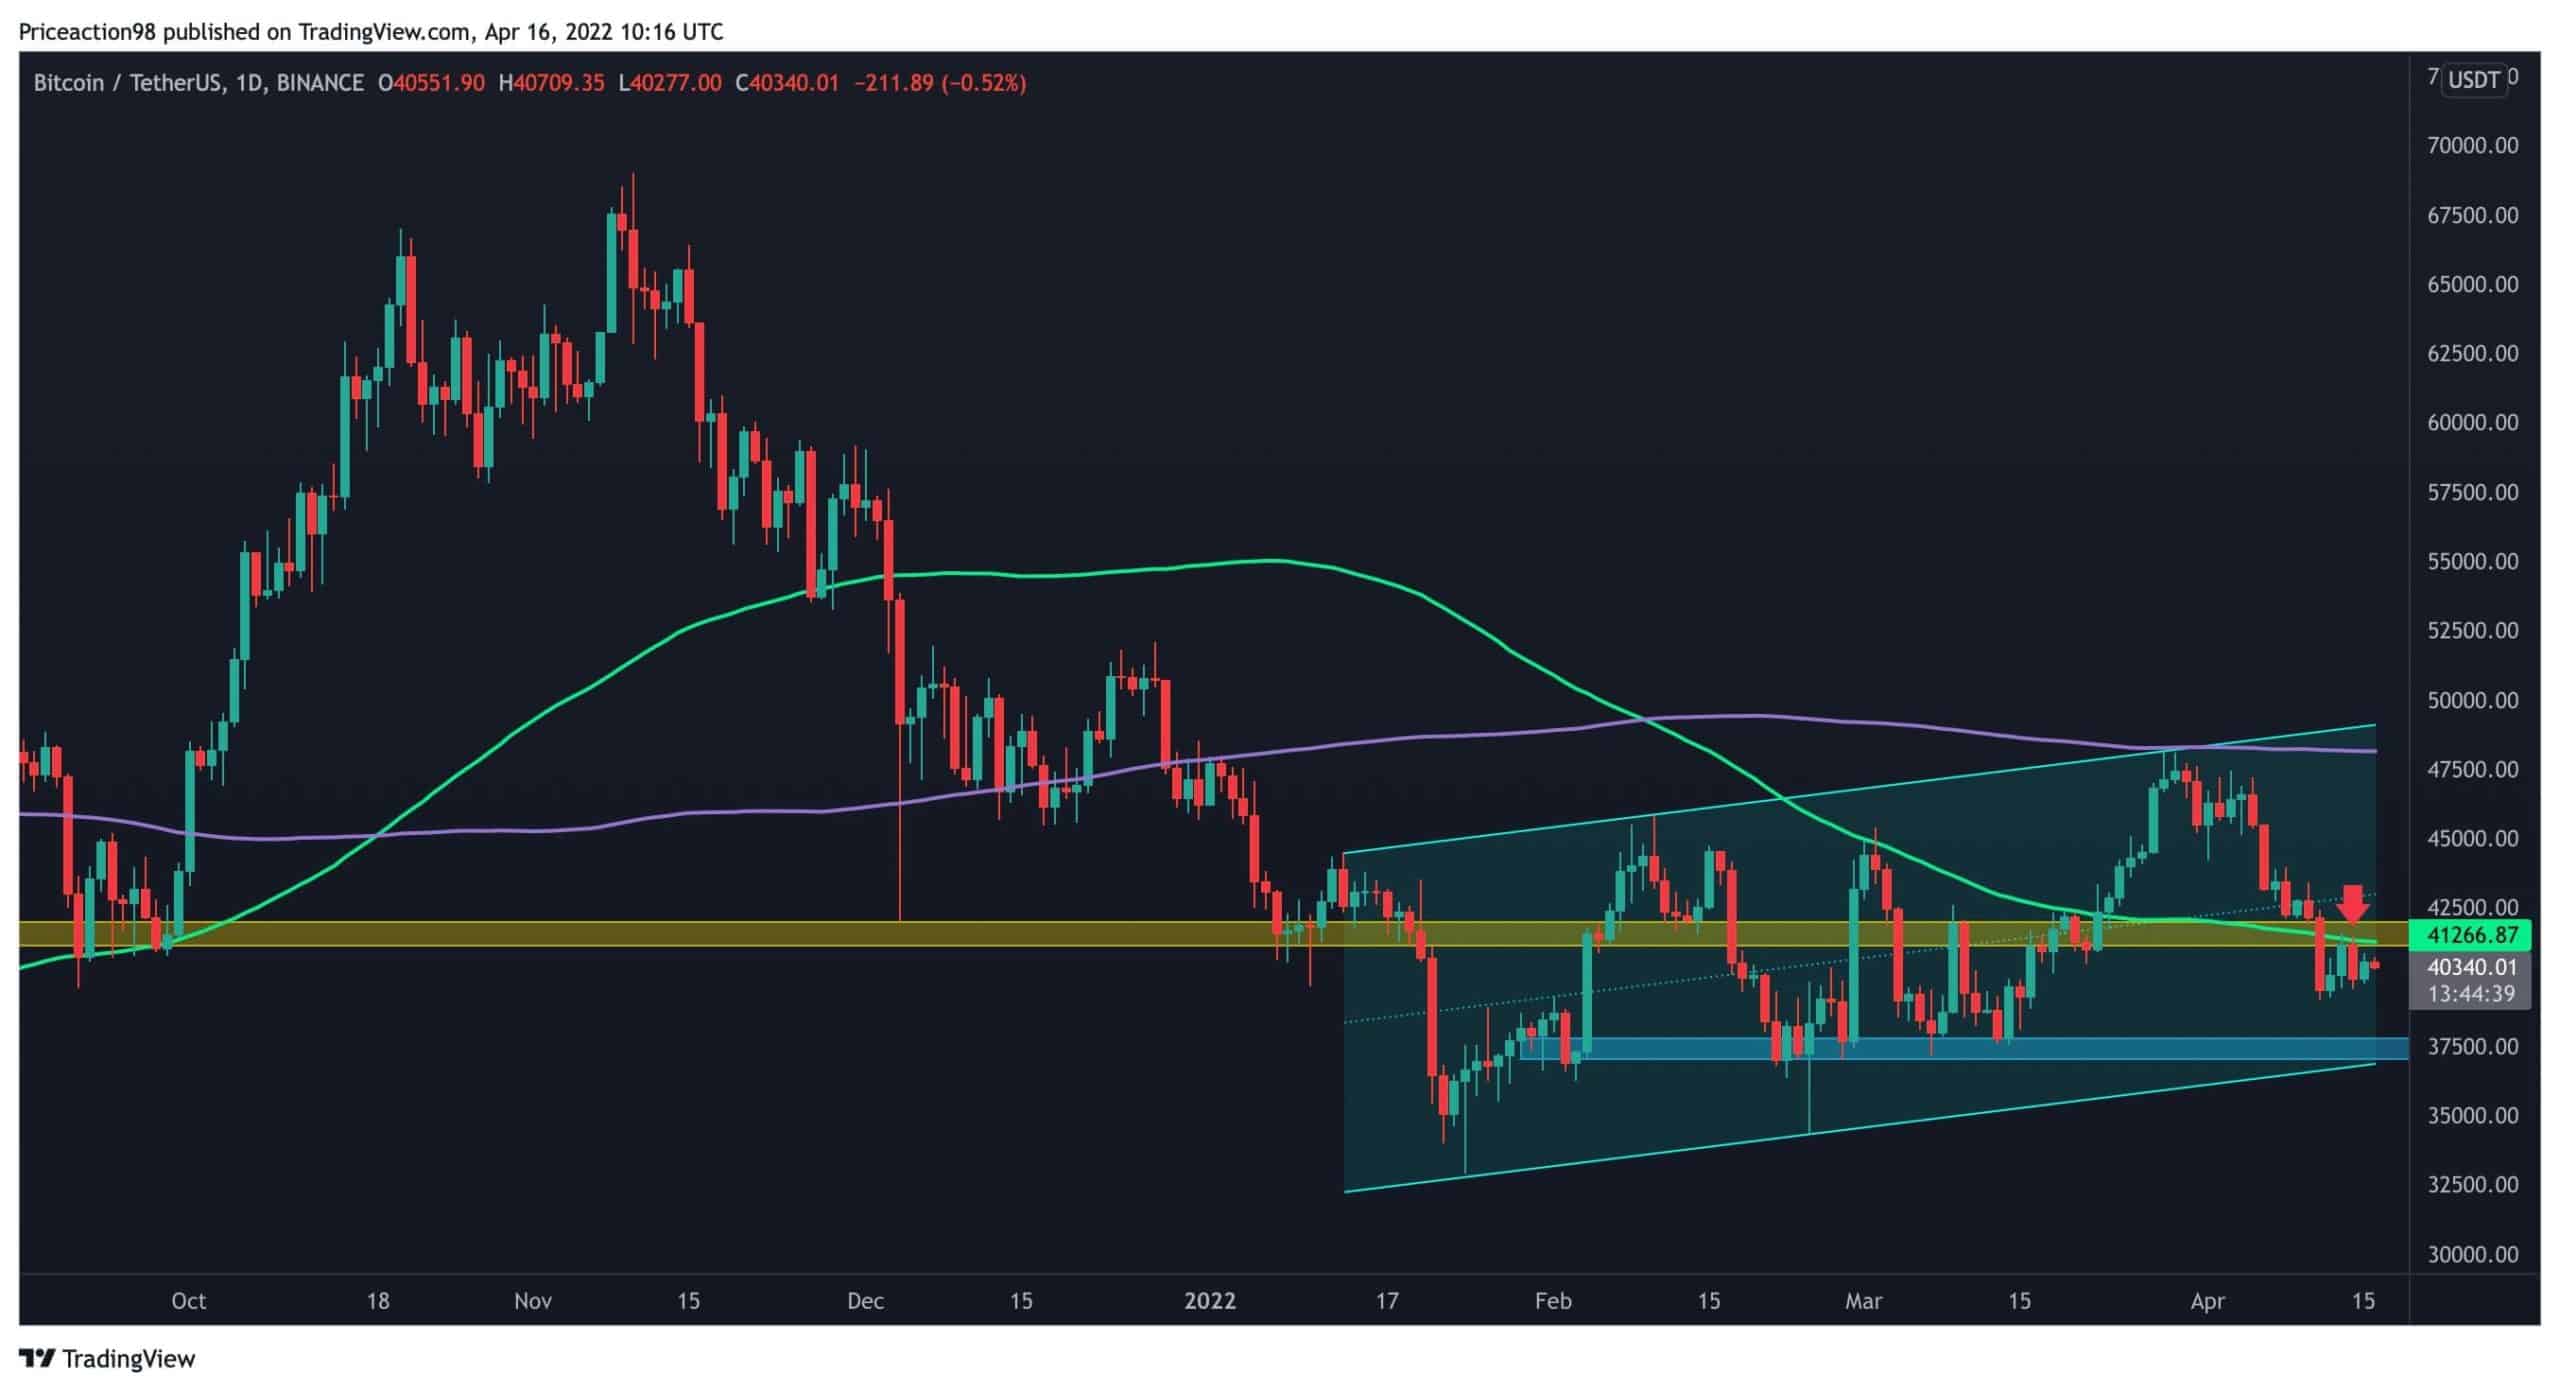
Over the past week, the price of bitcoin has been plummeting with strong bearish momentum, resulting in a break below the 50-day and 100-day moving averages lines on the daily timeframe, indicating that the bears are presently in control of the market.
Technical analysis by Shayan
However, the recent price action suggests that the negative momentum had weakened. The price experienced a short-term bullish leg towards $41.6K, which got rejected. But this can be considered as a pullback to the $41-42K resistance level.
In the bigger picture, the $37K demand zone remains the next significant level of support for Bitcoin. Given the market’s bearish momentum and sentiment, another bearish swing towards the $37K support level looks imminent.
If the price breaks below the stated support level, the most probable scenario is a collapse towards the $33K critical demand zone.
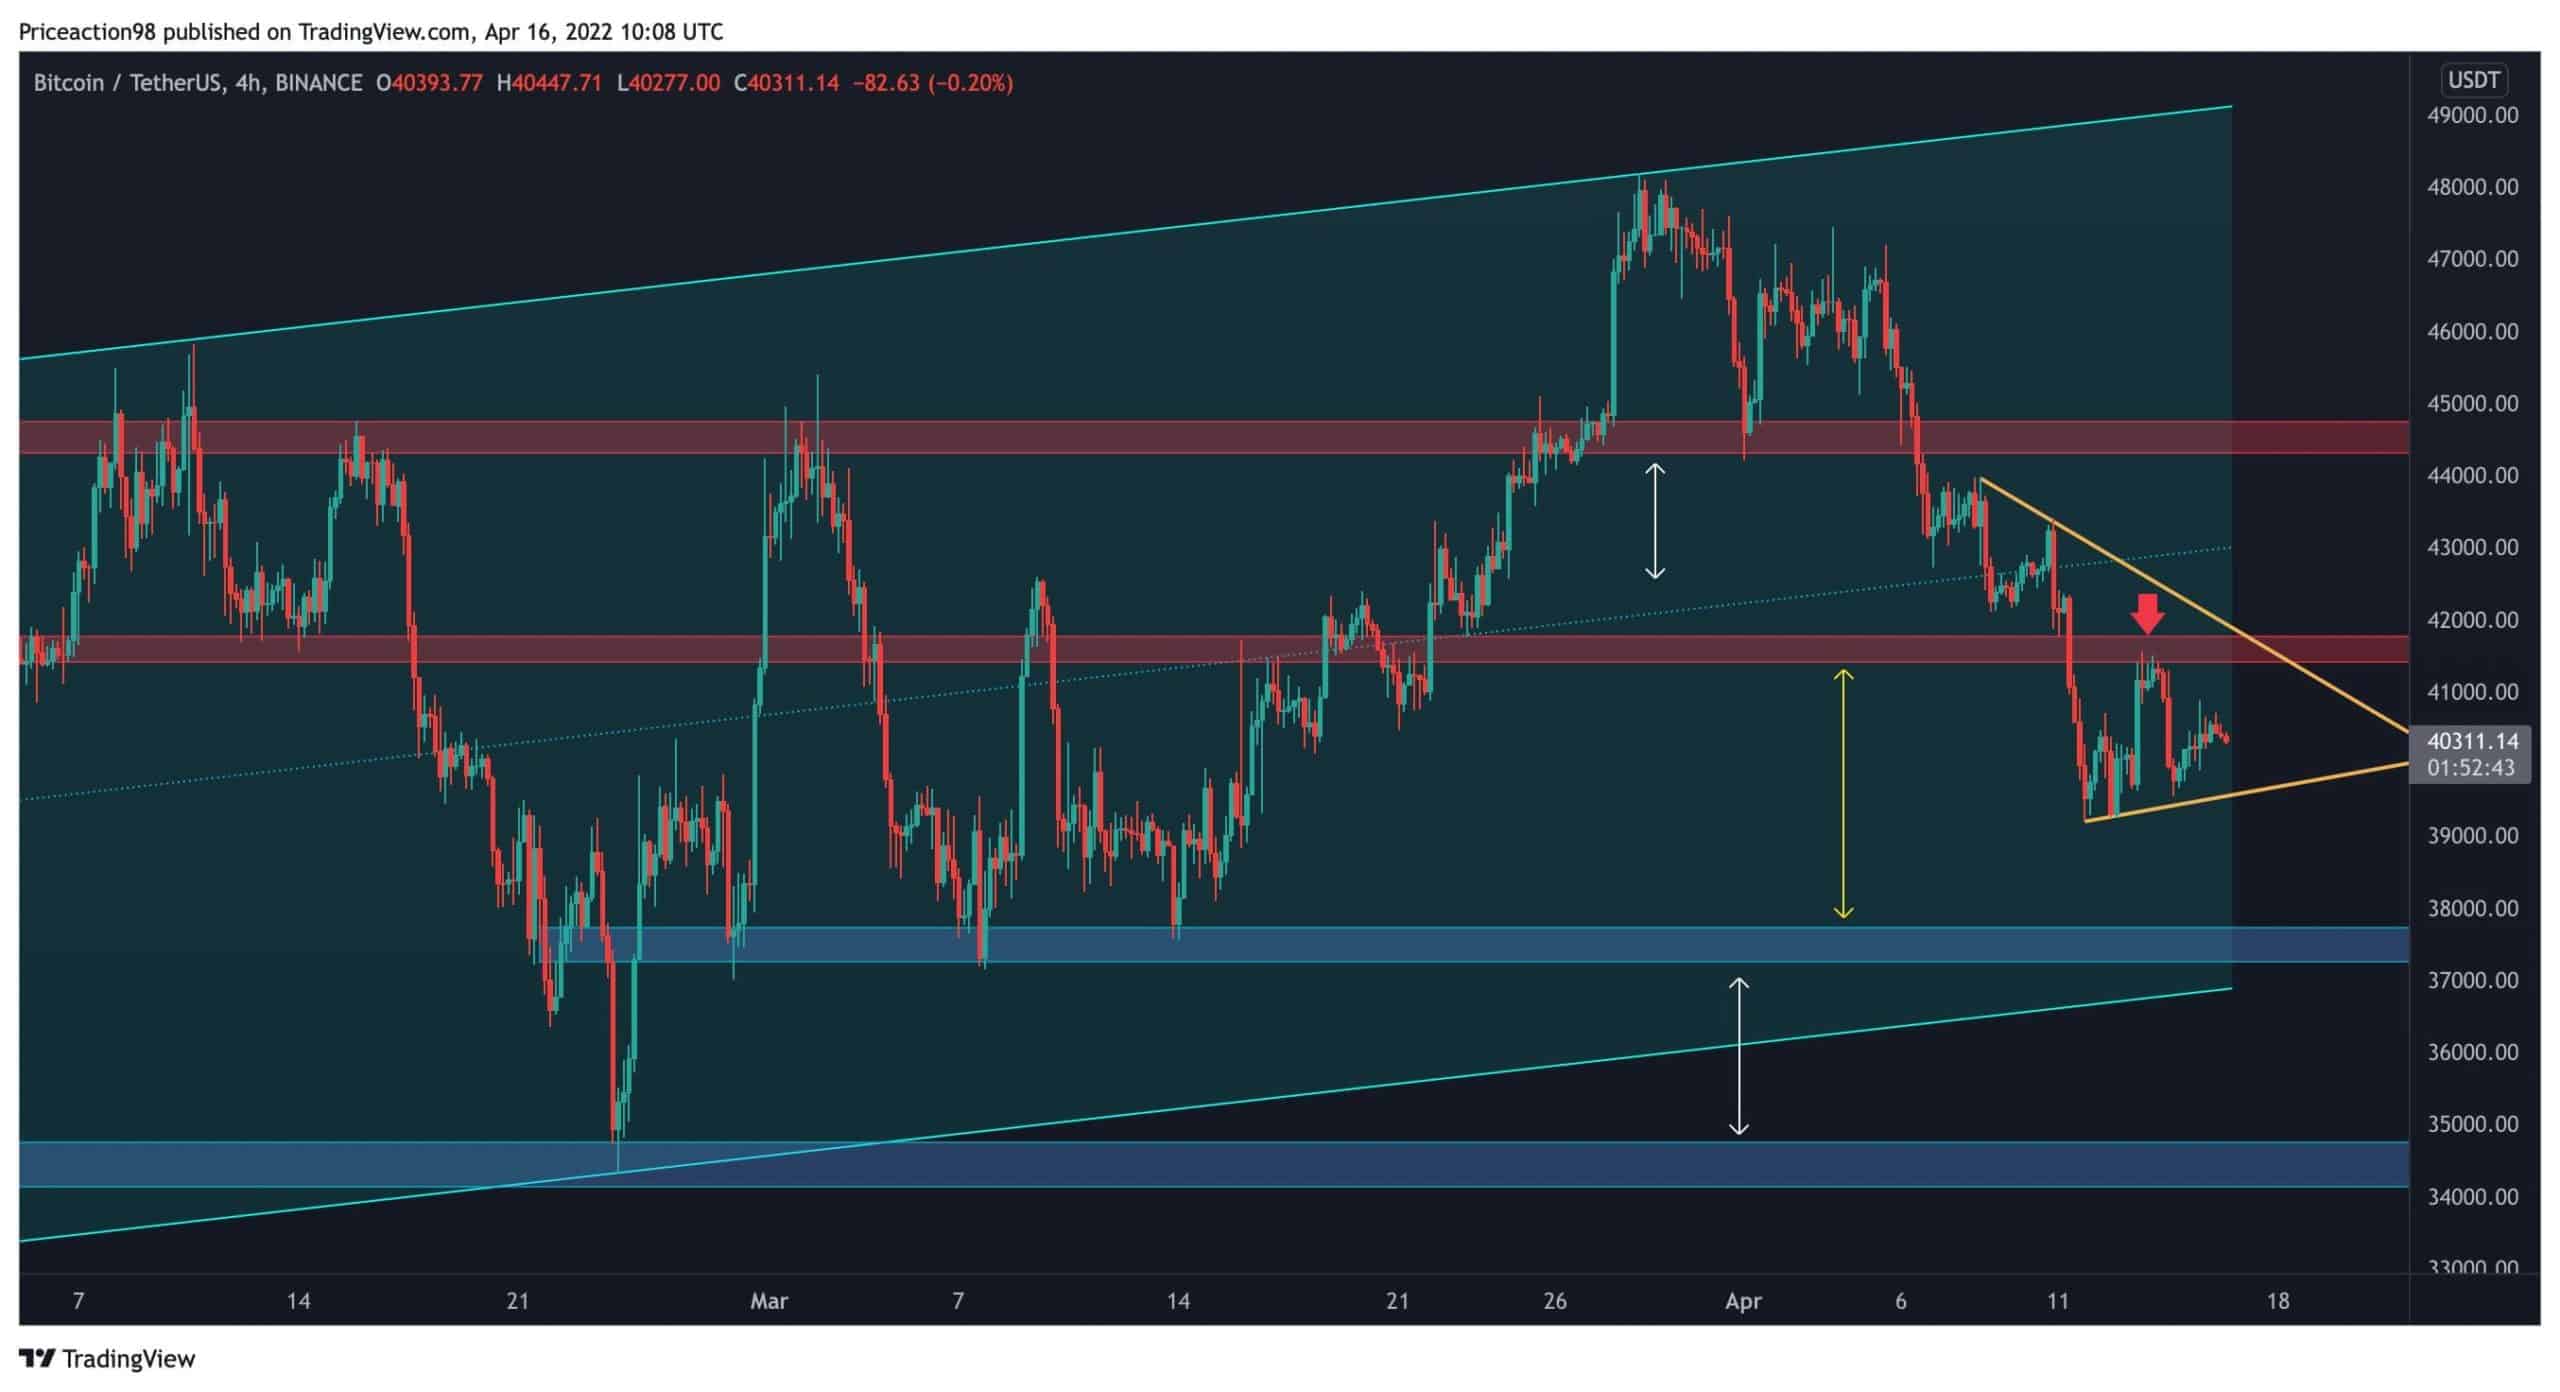
The bulls attempted to test and break above the $42K resistance level but failed.
In the short-term timeframe, two trendlines are forming a triangle price action pattern. A breakout in each direction may cause another leg to the next support/resistance level.
As of now, Bitcoin has three price ranges in the lower timeframe: The first is the $37-42K band, which the price has already entered now, and is consolidating inside.
Based on the current market condition and existing uncertainty, Bitcoin is expected to continue and consolidate in these three price ranges in the medium term.
By Edris
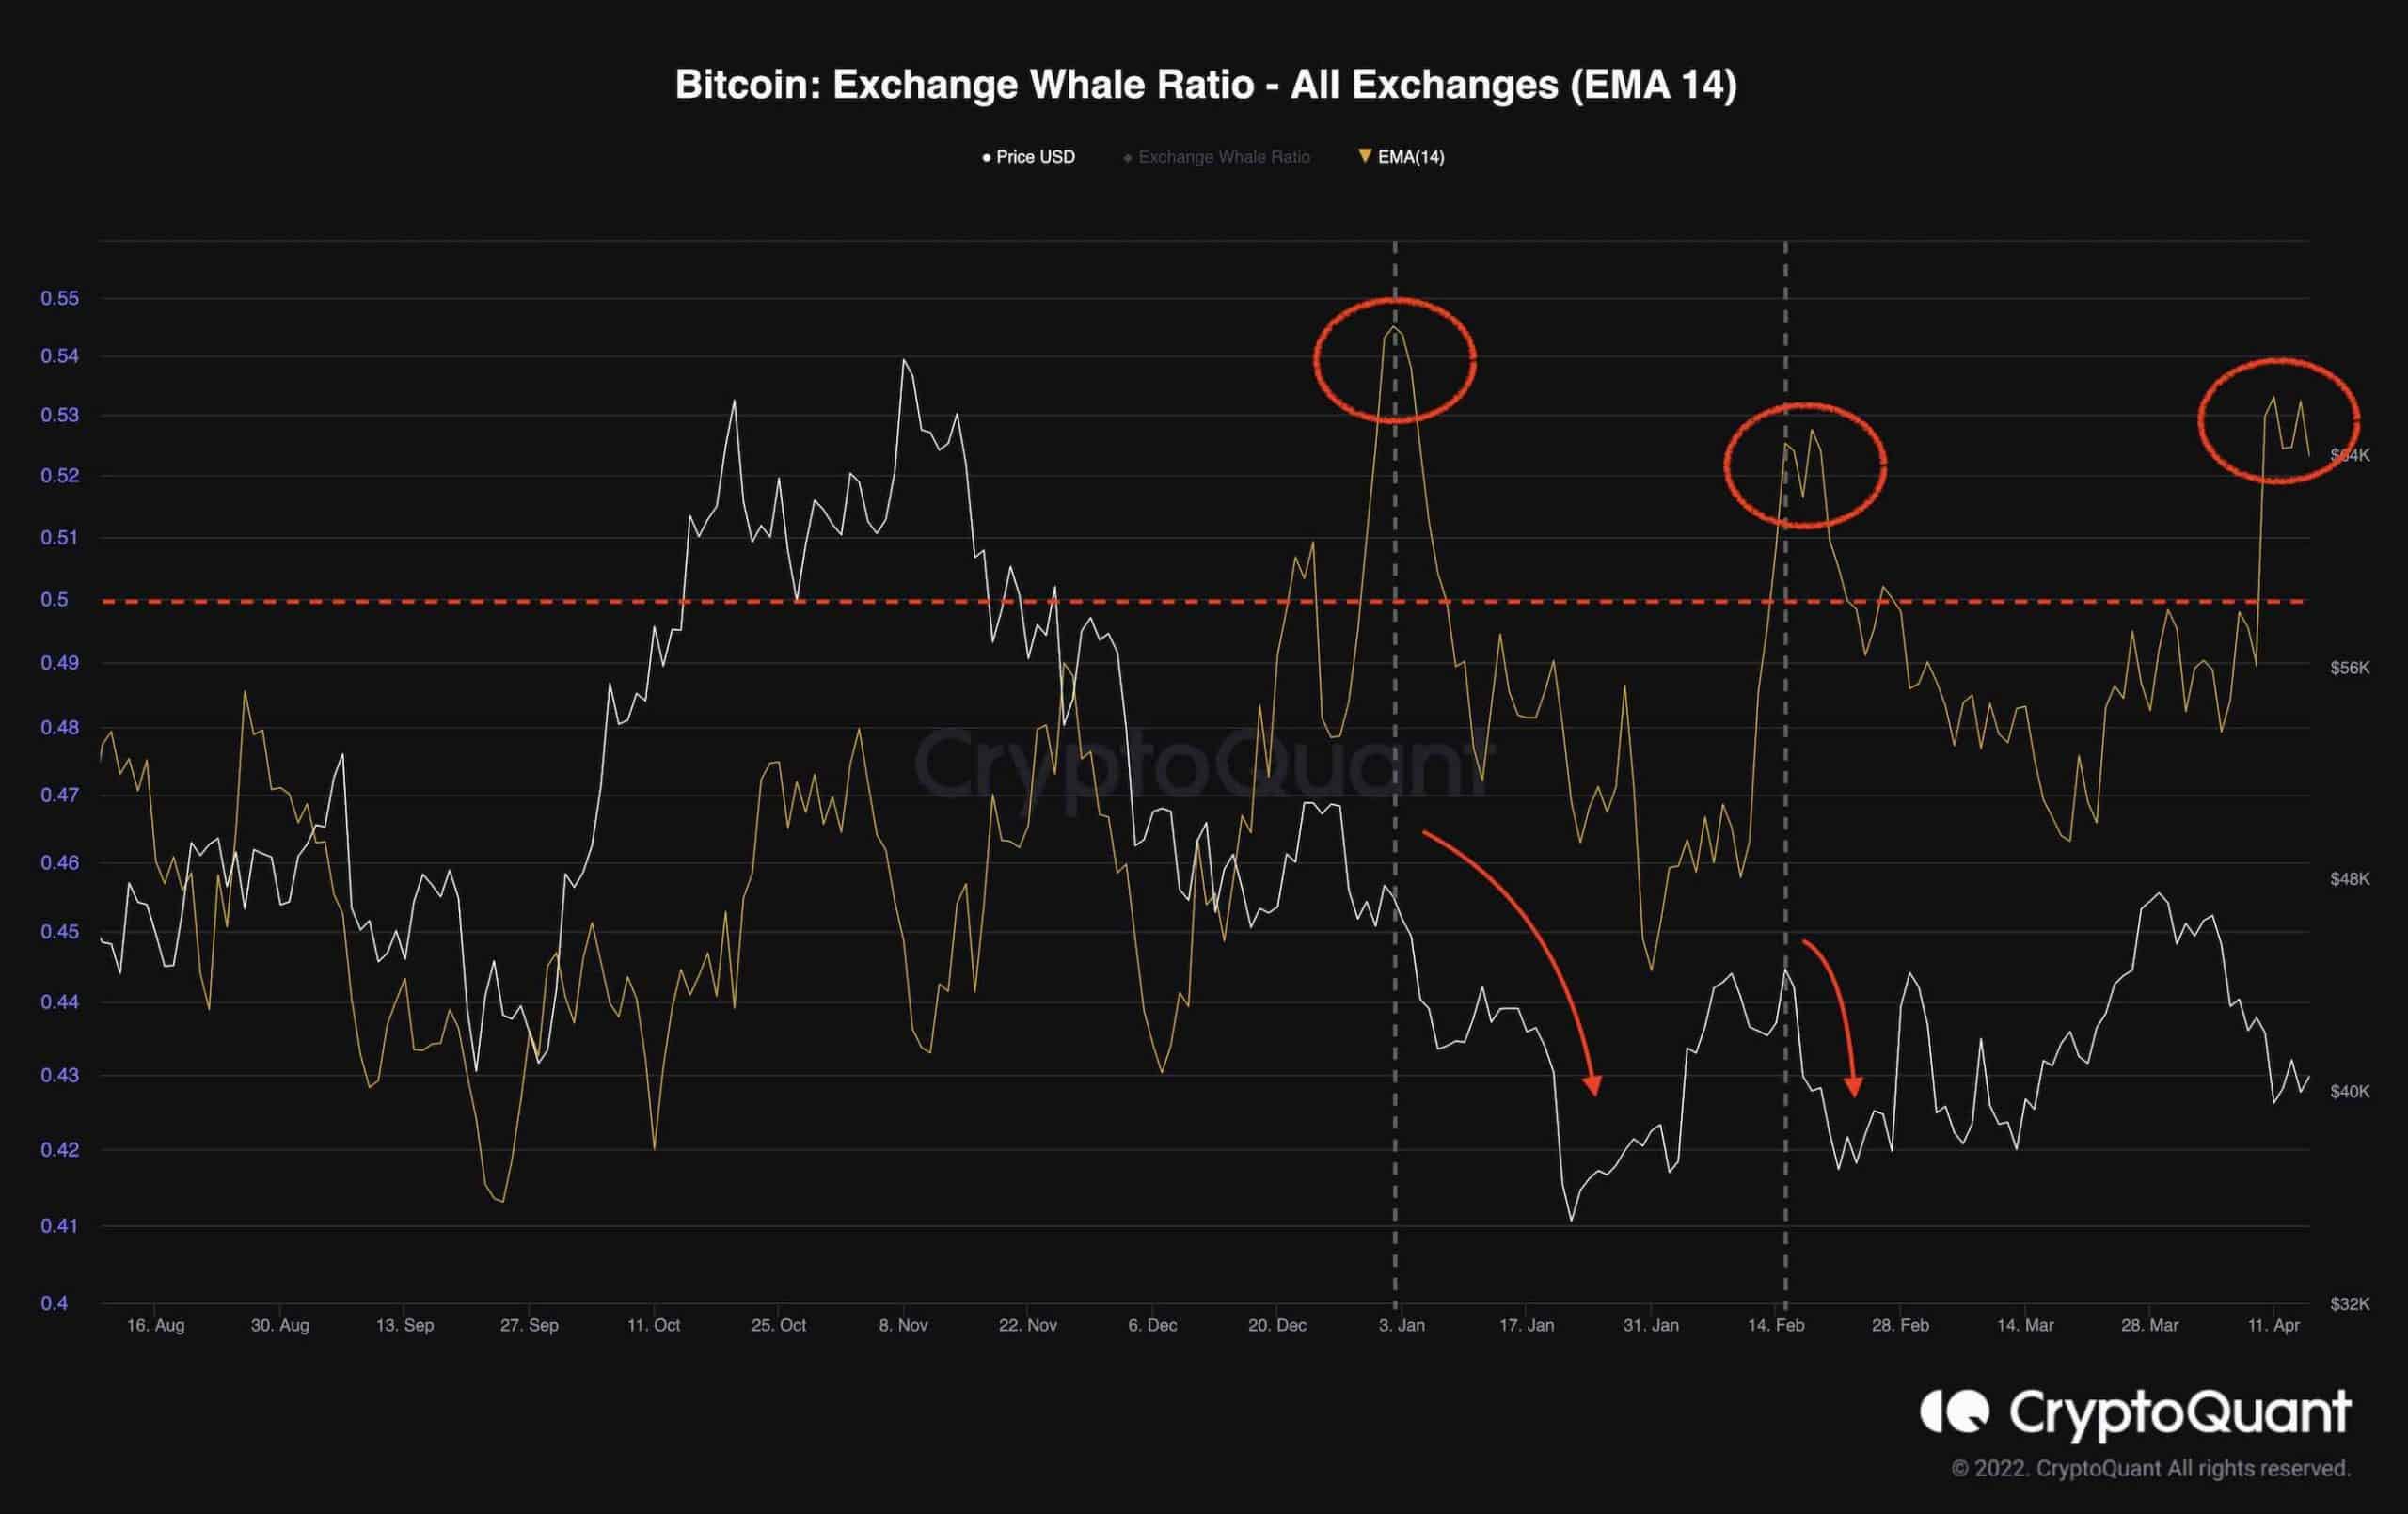
The Whale Ratio is a useful indicator for predicting volatility in the short term. This metric is the ratio of the top 10 exchange inflows to the total inflows of the exchanges.
The chart presents an acceptable approximation of whether the whales or retailers deposit their coins into exchanges. High values in this metric are considered bearish indicating that the whales are likely to create selling pressure which could lead to a drop in price in the short term.
The 14-day EMA has been applied to the data for better visual interpretation and a smoother chart. Looking at the following chart, values above 0.5 have occurred before price drops over the past few months.
Currently, this metric is showing high values once again which could point to more downside for the price in the short term.