The past weekend was crazy even for the most experienced crypto traders, who couldn’t remember when was the last time they saw a 42% change in the price of Bitcoin in under 24 hours took place.
Since then, Bitcoin’s raging volatility had been declining as the weekdays passed, and now, precisely a week since the colossal $4,000 price surge, it looks like the next move is a matter of hours, maybe 1-2 days.
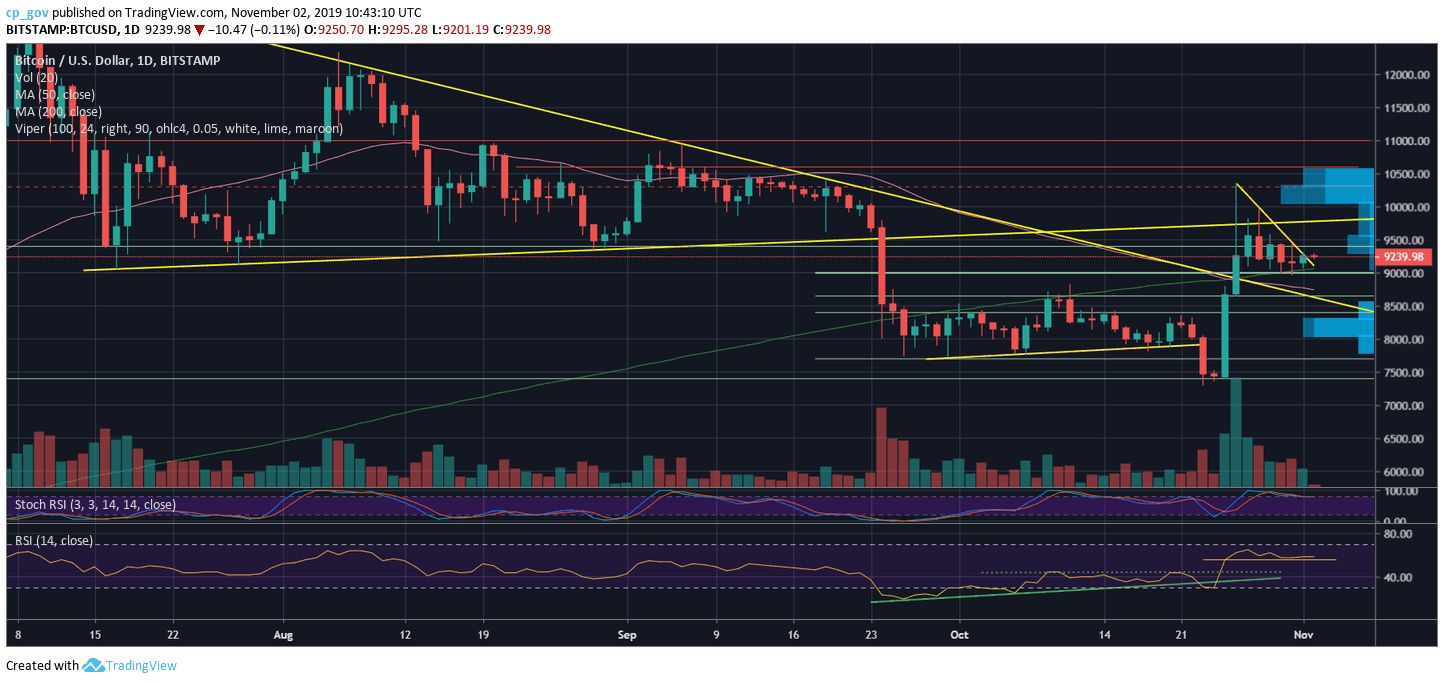
At least one sign is pointing bullish – Bitcoin kept above the significant 200-days moving average line (marked light green on the following chart) for the whole week since it was broken above during Saturday.
The bad news is that the MA line is slowly climbing, and as of writing this, it lies around $9,060, which makes the current price levels a little fragile getting very close to it.
The trading volume, aggregated from the top crypto exchanges, is declining since last Saturday’s action. This also supports the idea of a huge coming-up price move.
The RSI indicator (daily) is stable around the 56 resistance turned support price area. This is another decision point.
Total Market Cap: $247.6 billion
Bitcoin Market Cap: $167 billion
BTC Dominance Index: 67.5%
*Data by CoinGecko
– Support/Resistance: From below, the first level of support is the nearby $9200 price level. Right below lies the 200-days moving average line – currently around $9,060, as mentioned above. Further below is the $8900 – $9000, including strong resistance (which held the current price level nicely). The next level of possible support is the Golden Fibonacci, 61.8%, roughly around $8500, followed by $8400.
In case of a break-up, Bitcoin’s next serious resistance area is the $9400 – $9500, which Bitcoin failed to break two days ago. Further above is $9800 before the significant $10,000 legendary resistance (lots of seller’s supply chunks waiting there, as can be seen on the chart by the VPVR – attached to the right side in light blue). Further above lies $10,300 – $10,400 (Saturday’s high). Higher targets are $10,600 and $11,000 (significant resistance).