That was a crazy day for the price of Bitcoin. Some would say it’s an ordinary day, but as we wrote here in yesterday’s price analysis, after sideways action in a tight range, the primary cryptocurrency had exploded.
After trading for the last few days between $6800 – $7000, it first started with a deep below the critical $6600 support, whereas the daily low was around $6472 (Bitstamp), which is the next-mentioned support level we had stated here yesterday.
But it was only a quick glitch below the $6600 because, for the following hours, we saw Bitcoin trading safely above the crucial level.
Over the past two hours, we saw Bitcoin firing up – from the $6600 price area to a current high at $7150 (Bitstamp). That’s roughly a $500 gain in just two hours. Business as usual for Bitcoin?
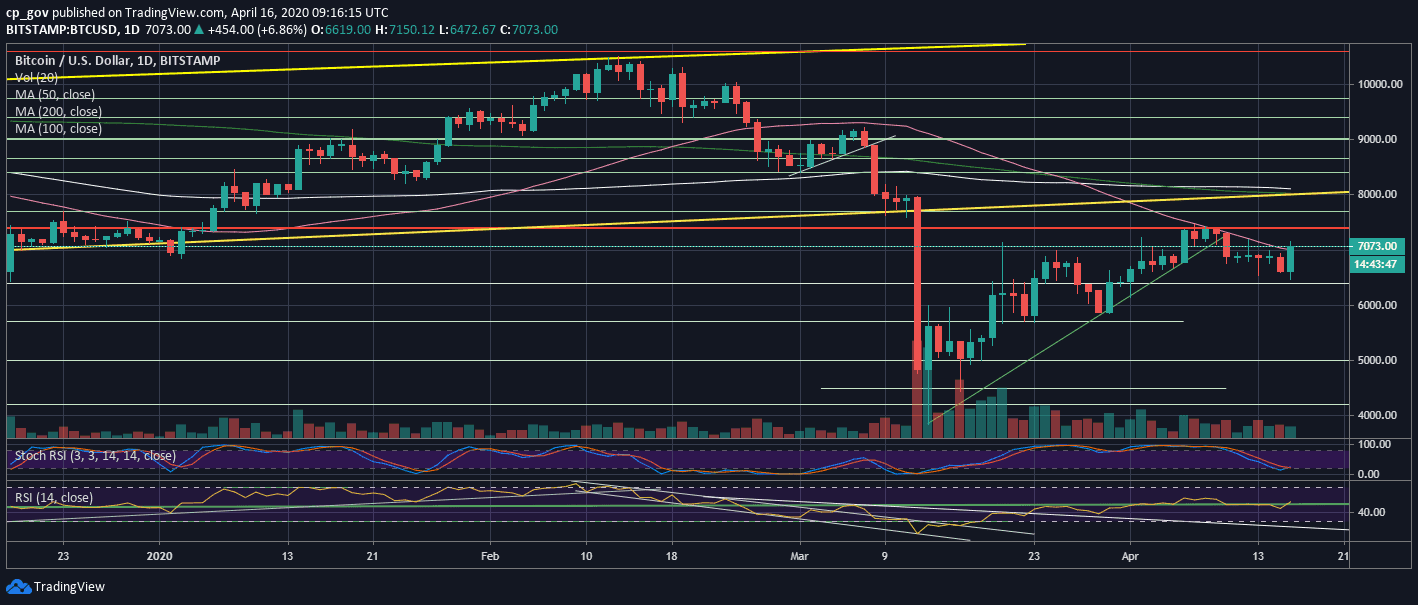
As of now, Bitcoin looks short-term bullish. However, we will have to see how the daily candle closes. It’s crucial to see a daily close above the $7000 benchmark, along with the 50-days moving average line.
Looking at the momentum indicator, the RSI is now pointing up, hovering slightly above the 50 mark. Maintaining this level is also crucial for the short-term.
Besides, the daily Stochastic RSI oscillator had made a crossover at the oversold area and about to enter the neutral territory. This aligns with the bullish reversal.
From the bearish side, we will have to see Bitcoin holding this price area. As we learned about the recent era, the Bitcoin price is in correlation with the global stock markets. As of writing these lines, Wall Street futures trading over 1% in the green, which aligns with Bitcoin.
Total Market Cap: $200.5 billion
Bitcoin Market Cap: $128.6 billion
BTC Dominance Index: 64%
*Data by CoinGecko
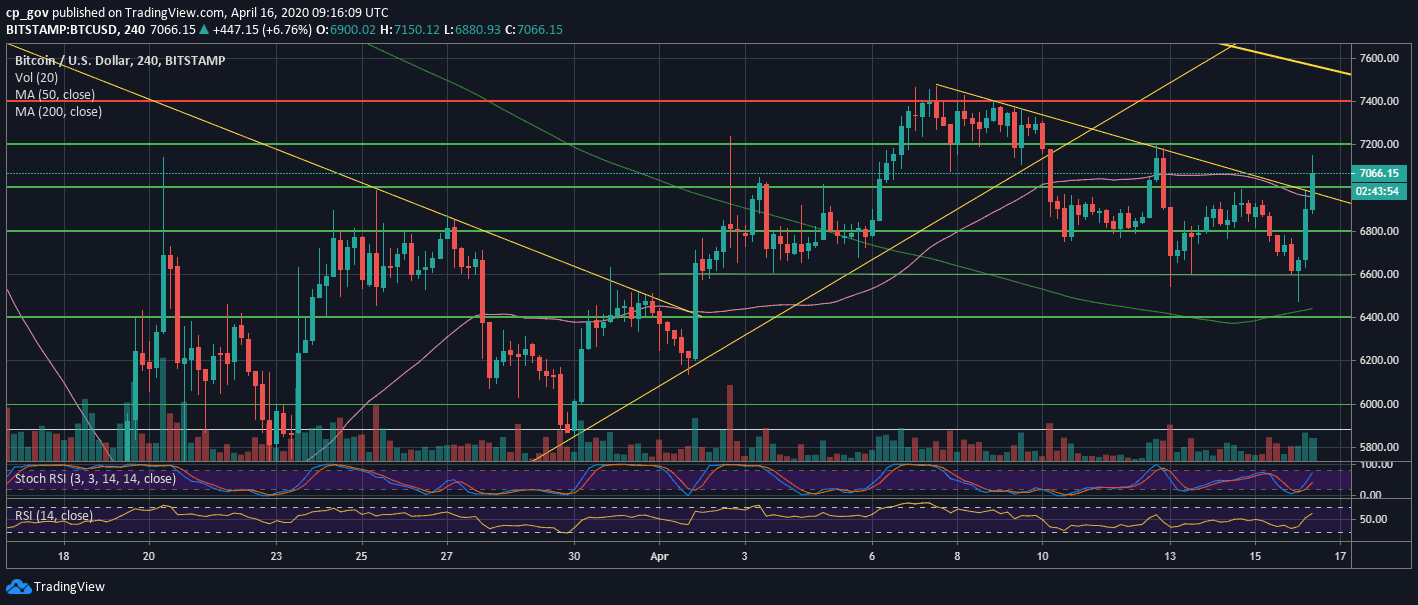
– Support/Resistance levels: Following the breakout of the $7K zone, along with the descending trend-line as can be seen on the following 4-hour chart, Bitcoin is now facing $7150 – $7200 resistance as its first mission. Further above is the 10-day high at around $7400 – $7500. The latter is the highest-level Bitcoin price had seen since the COVID-19 crisis had begun.
From below, the $7K now becomes the first level of support, together with the 50-days moving average line (marked pink). A little below lies $6800, followed by $6600.
– The RSI Indicator: discussed above.
– Trading volume: The declining volume had ended as expected with a crazy day like today. It will be interesting to see what the price and the volume level will be at the end of today.