Since the coronavirus crisis had started, in the second week of March, we mentioned the obvious correlation between Bitcoin price and the global markets.
Since the crisis started, the lowest point of Bitcoin was reached together with the S&P 500’s low, and the impressive correction can be seen on both assets’ charts.
However, unlike the S&P 500, which reached a new April high following Tuesday’s 4% rally, and Gold’s 8-year high, Bitcoin barely moved. Is it a bearish sign? It could indicate on weakness, but it can also point on decoupling from the correlation.
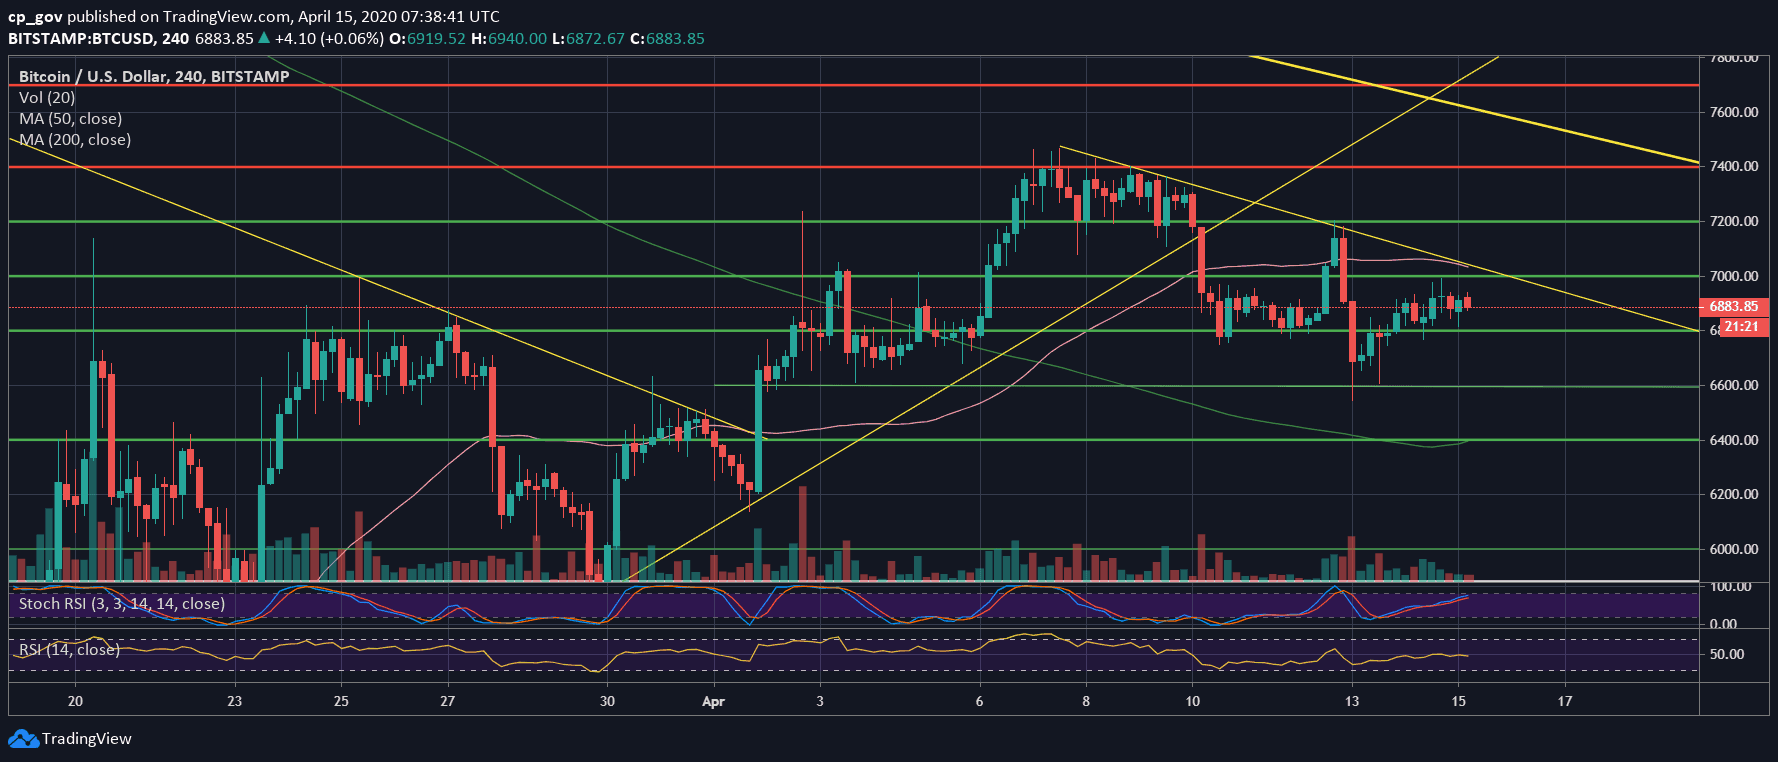
The fact is that Bitcoin is trading again between the $6800 and the $7000 range. Despite an abnormal move (the pump to $7200 and the dump to $6600), the above range defines Bitcoin’s behavior for the past five days.
Because Bitcoin doesn’t like to stay for a long time at one spot, and the RSI is also indecisive around the 50 range, along with declining amount of volume, we predict that a breakout from this range is likely to take place soon.
In case of a breakdown of $6800, the $6600 could be crucial for the bulls. Looking at the 4-hour chart, we can see a Head & Shoulders pattern that can play out, with a target at $5700 in case of breaking down the $6600 in the short-term.
Total Market Cap: $197 billion
Bitcoin Market Cap: $126 billion
BTC Dominance Index: 64.1%
*Data by CoinGecko
– Support/Resistance levels: As mentioned above, Bitcoin is trading between $6800 and $7000 for the past days.
From below, in case $6800 gets broken, then the next support level lies at $6550 – $6600. This is followed by $6400 and the $6000 – $6200 price area.
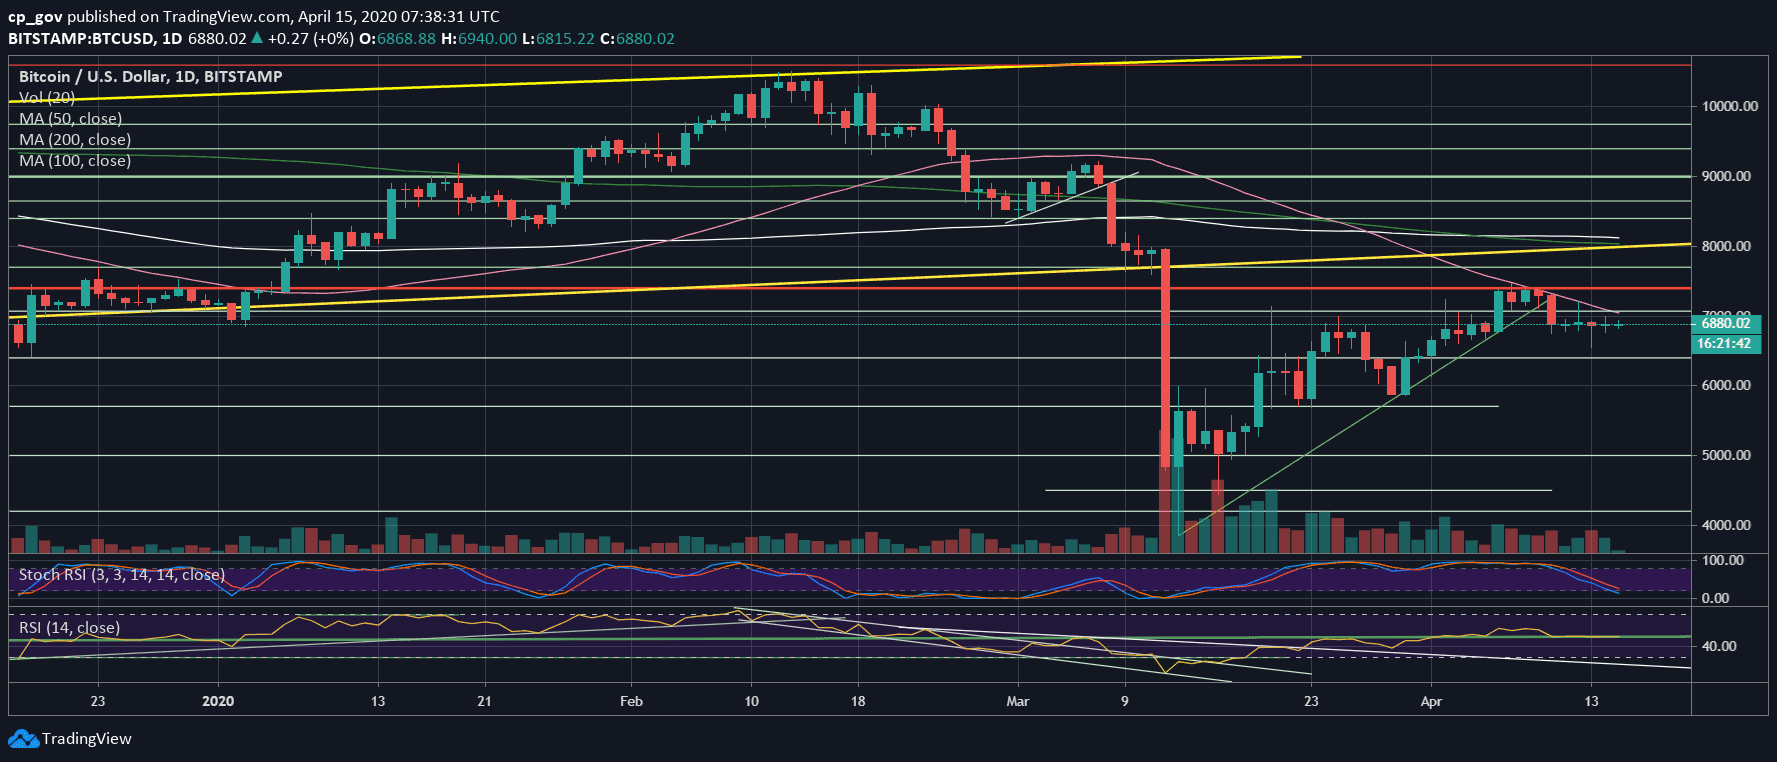
From above, in case $7000, along with the descending trend-line (4-hour) and the 50-days MA (daily chart, marked by pink line), gets broken up, then the next resistance is the $7200 zone, followed by $7400 – $7500 which is where the monthly-high lies.
– The RSI Indicator: As discussed above, the RSI is indecisive around the 48-50 range. If the price breaks above or below the range, we will likely see a reflection on the RSI.
– Trading volume: As expected, the tight range carries a low amount of volume. Another sign that a significant move is coming.