Over the past two days, we saw Bitcoin trading in a tight range between $8000 from above and $7800 from below.
The bigger picture from our previous analysis hadn’t changed much, following Bitcoin holding up the past two week’s crucial support level of $7400 – $7500.
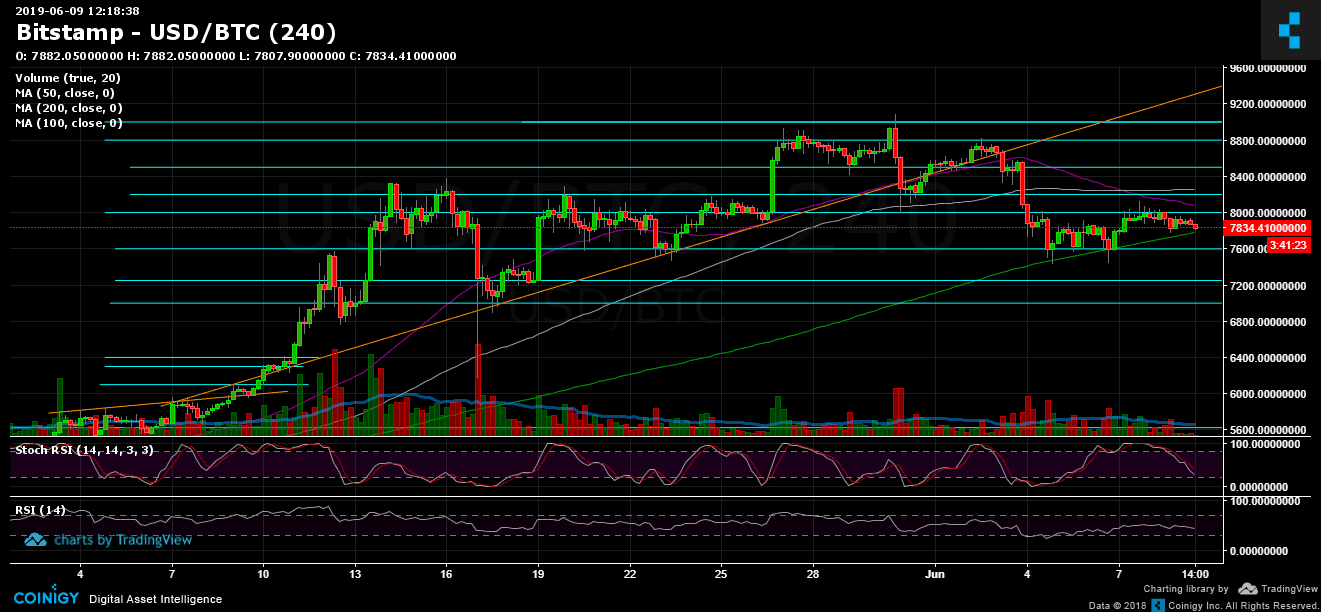
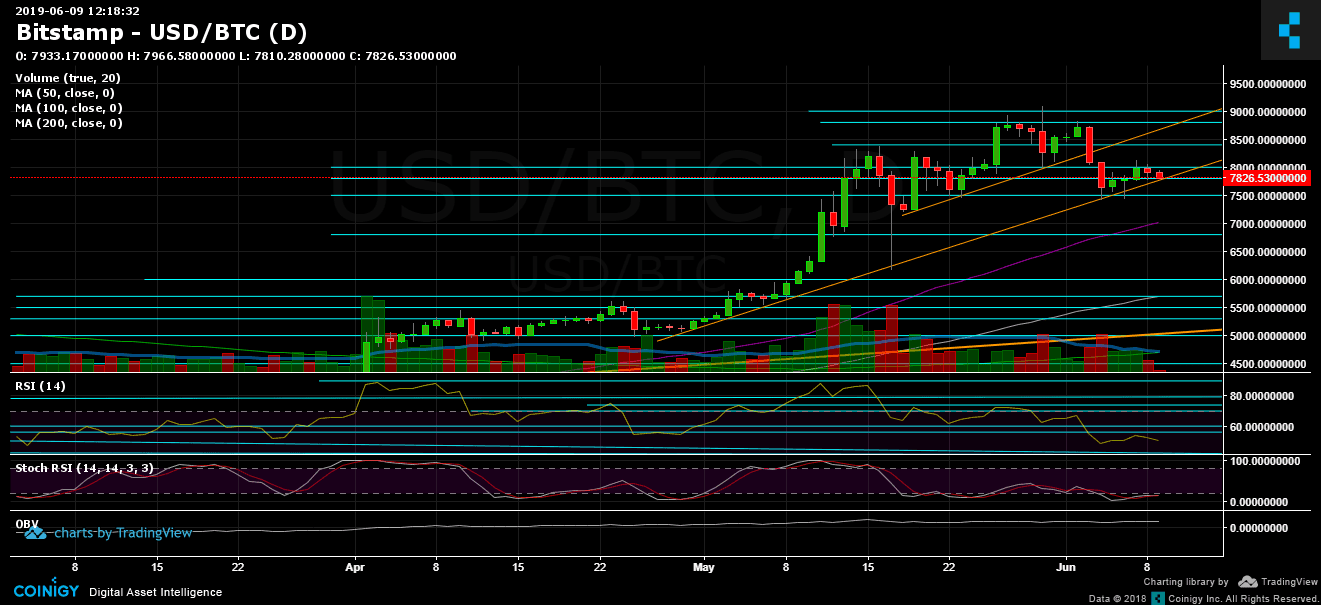
As can be seen on the daily chart, Bitcoin is now facing the mid-term ascending trend-line, along with the 4-hour chart’s MA-200 (marked in light green). Anything can happen here: a break-down and we will likely see Bitcoin testing $7500 for the third time during the past five days. Remember that the more times a support level is being tested, the higher the chances for a breakdown of the level.
From the other side, in case that Bitcoin holds here, there is much more space to go higher.
Total Market Cap: $251 Billion
Bitcoin Market Cap: $139.4 Billion
BTC Dominance: 55.5%
– Support/Resistance:
From the bullish side, Bitcoin is still facing the nearest level of resistance around the $8000 area, that couldn’t get breached yesterday. In case of a bullish breakout of $8000, the next resistance lies at $8200 – $8250 (the 4-hour chart’s MA-100), further above is $8400, $8500, $8800 and the 2019 high around $9000 – $9100.
From below, the nearest level of support is the $7700 – $7800 level, where Bitcoin is currently trading, along with the 4-hour chart’s MA-200 and the mid-term ascending trend-line. Further below lies $7600 and the strong support at $7500, as mentioned above. Below lies the $7250 and $7000, which is also the daily chart’s 50 days moving average line (marked in purple).
– Trading Volume: The trading volume is relatively low, probably because of the weekend. As can be seen, over the past week, the volume of the sellers was significantly higher than the buyers’.
– Daily chart’s RSI: Not much a change since our previous analysis. The RSI is struggling to stay above the 50 level. Stochastic RSI oscillator of the daily chart is at its oversold levels. This could fire up bullish momentum, in case of holding the current support area.
– BitFinex open short positions: There are currently 18.2 K BTC of open short positions. The number had gained a bit, but still relatively low.