Since yesterday’s analysis, Bitcoin has plunged to a new yearly low of $3470 (Bitstamp). This is about an 83% decrease from BTC’s all-time high. Is that all for now? Maybe….
When we see such violent changes to any side, we can expect more, this time to the opposing side: In a 5-hour move, Bitcoin gained more than $500 to re-test the support turned resistance level around the $4K area. We mentioned that in yesterday’s analysis:
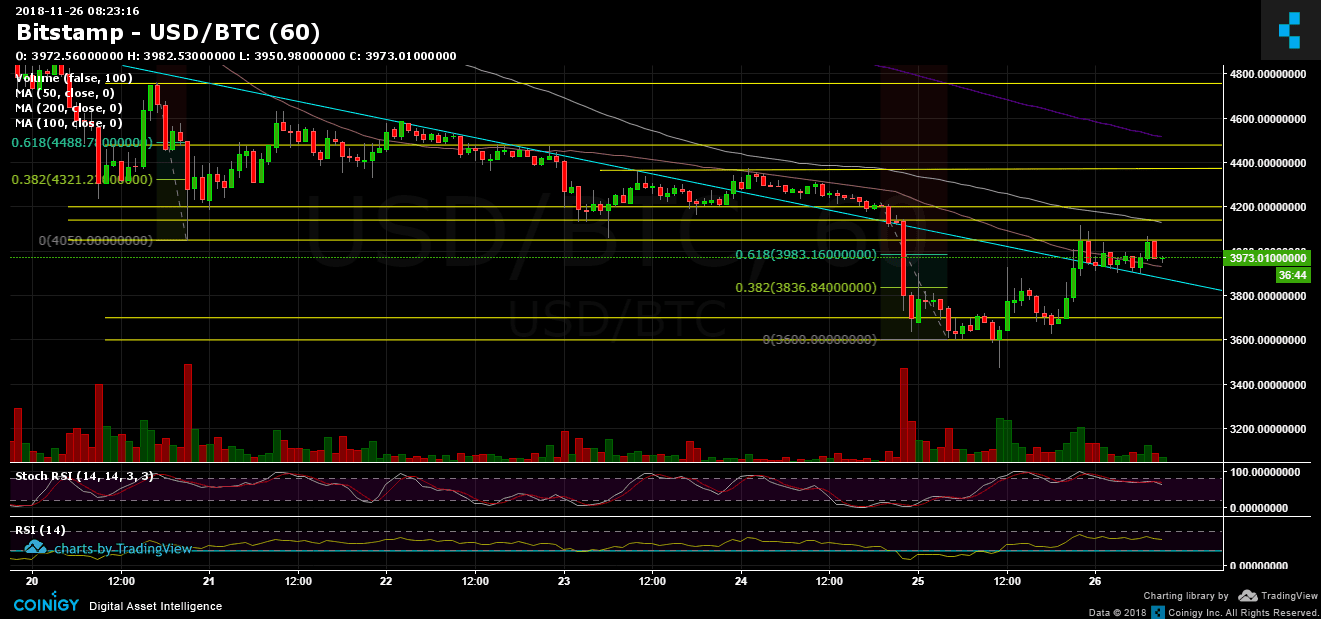
Breaking the $3700 is likely to send Bitcoin to these Fibonacci retracement levels: ~$3830 (38.2%) and ~$4000 (support-turned resistance along with the Fib level of 61.8%).
Over the past few hours, Bitcoin is consolidating between the above resistance level on top of the 50 day moving average line (marked in orange).
Is the blood over yet? Too early to tell. Bitcoin is still in a bear market, and so far this is just a deeper correction to the severe declines since breaking under the $6K mark.
Looking at the 1-day chart & 1-hour chart
- First signs of reversal: By looking at the hourly chart, we see higher green candles (buyers) than red ones (sellers). In a healthy growing market, there are more buyers than sellers. Are the buyers finally back? Too early to tell, but in the last day – it seems like that.
- In addition, the daily candle ended green in a Doji shape. This is also a bullish pattern.
- In case the $4K resistance mark is broken, there is a possibility of testing the $4550 area. The above is the Fibonacci retracement level 38.2%. I wouldn’t consider the market as bullish till breaking the above level with an impressive amount of volume.
- But there is always the other possibility: If Bitcoin fails to break the $4K level, it could quickly lose momentum, and the bears will get back to work: From below there are the $3500, $3300 levels and significant resistance at the $3000 level.
- The RSI indicator of the daily chart still has some room to climb up to get out of the bearish area. Stochastic RSI crossed into the oversold level a couple of days ago – this may leave some space for BTC to go up.
- BitFinex’s open short positions have declined to around 30K, after yesterday’s daily high of 35K.
BTC/USD BitStamp 1-Hour chart
BTC/USD BitStamp 1-Day chart
Cryptocurrency charts by TradingView. Technical analysis tools by Coinigy.
SPECIAL OFFER (Sponsored)
Binance Free $600 (CryptoPotato Exclusive): Use this link to register new account and receive $600 exclusive welcome offer on Binance (
full details).
LIMITED OFFER 2024 at BYDFi Exchange: Up to $2,888 welcome reward, use this link to register and open a 100 USDT-M position for free!
Disclaimer: Information found on CryptoPotato is those of writers quoted. It does not represent the opinions of CryptoPotato on whether to buy, sell, or hold any investments. You are advised to conduct your own research before making any investment decisions. Use provided information at your own risk. See Disclaimer for more information.