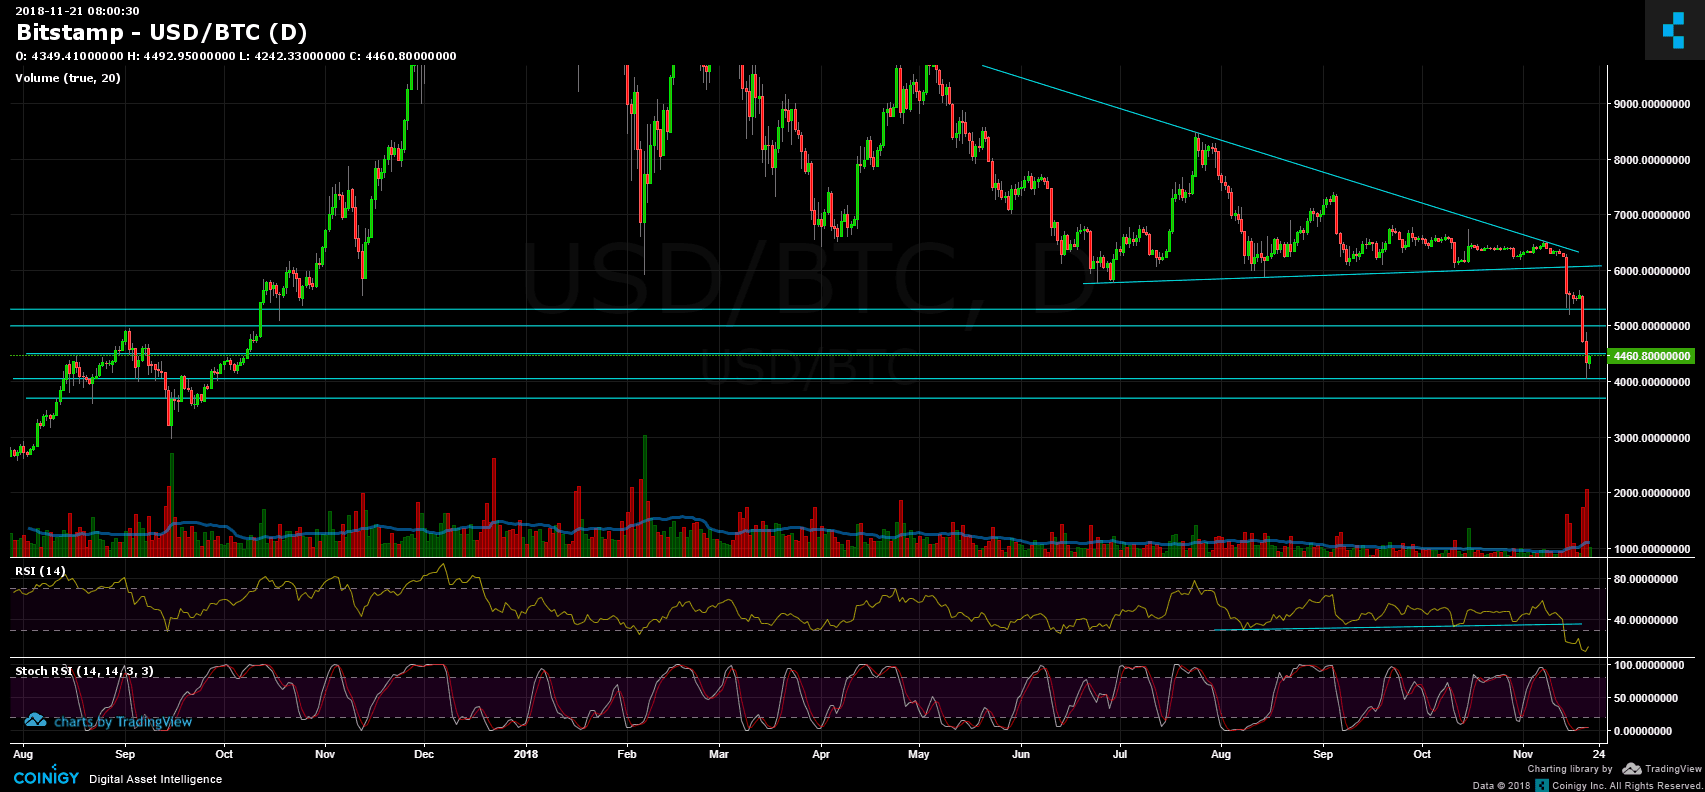
Unfortunate to all Bitcoin lovers, another low was captured. To whoever whose reading my BTC price analysis from yesterday, I stated there clearly that breaking the $4500 support level means that the next target is $4050. As seen by the following chart, Bitcoin’s yesterday’s low (actually the yearly low) is precisely at $4048.
Getting there, a slight correction has taken place. For the recent hours Bitcoin is consolidating between the $4200 – $4500 range.
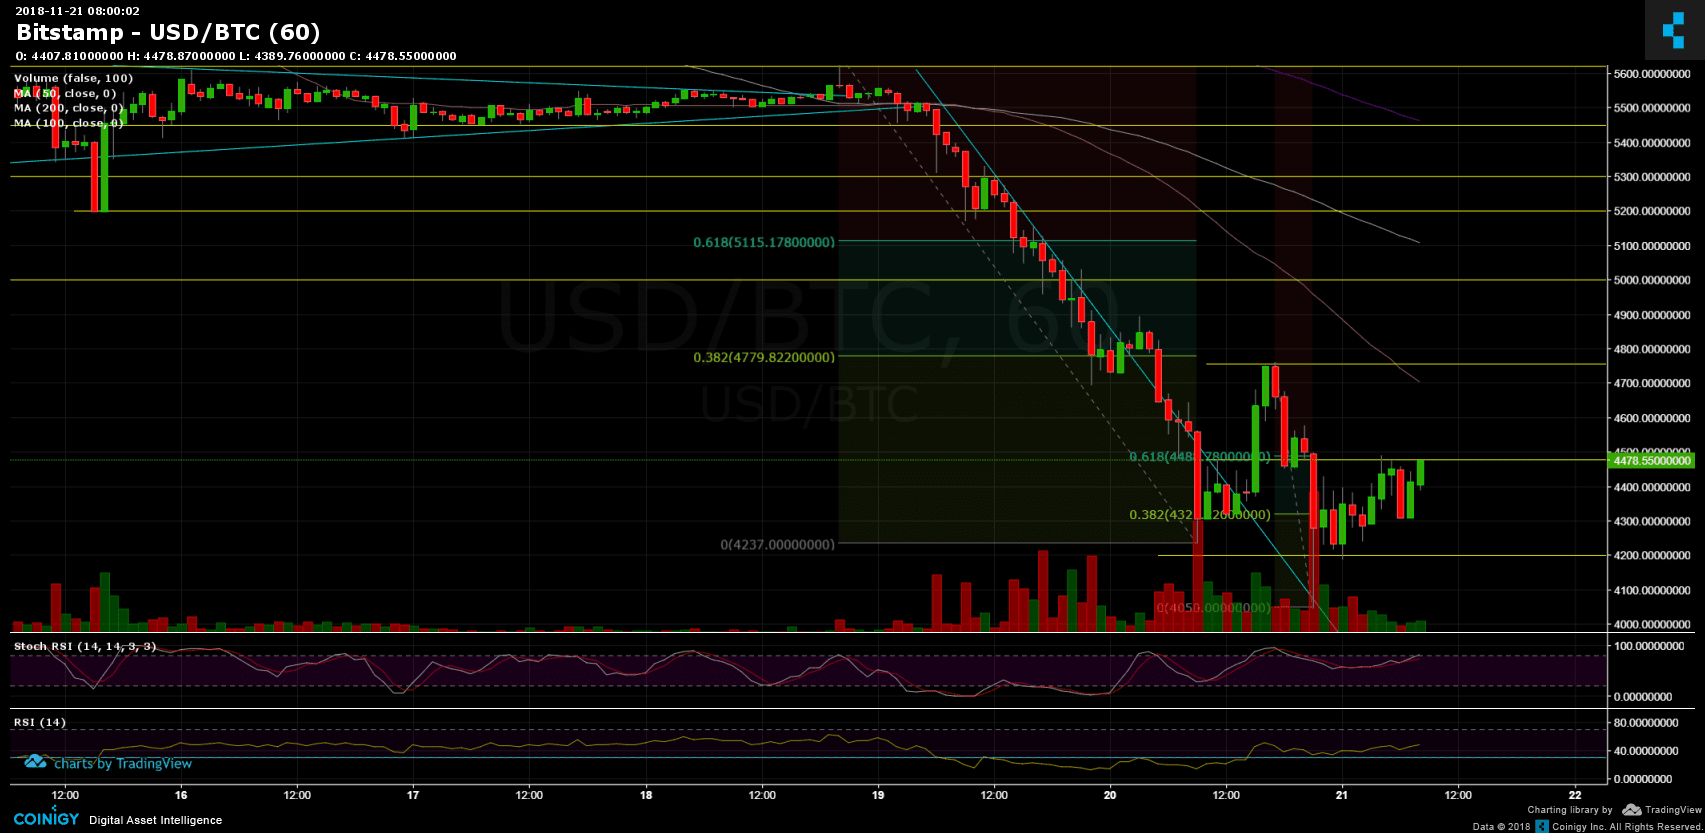
Interesting to notice is that Fibonacci retracement level %61.8 lies at $4488 which is the top boundary of the above range – which is significant resistance. Breaking $4500 support-turned resistance is the first key level for a more substantial correction than what we’ve seen so far.
The fibb level works: As you can also see, so far the downtrend from $5650 to $4250 was corrected exactly up to Fibb level %38.2 at $4750.
Looking at the 1-day chart & 1-hour chart:
- As mentioned, Bitcoin is trading for the past hours in the range of $4200 – $4500.
- From the bear side: After breaking $4500, the major support lies at $4000 ($4050). Breaking the above, the next support lies at $3700 and $3000 right after (which is 50% correction and the target to the prediction we published a week ago).
- From the bull side: In case of breaching the $4500 level, the next resistance area lies at $4700 – $4750. Behind is the $5000 and $5300 support-turned resistance levels.
- Stochastic RSI had crossed in the oversold level, which is the first sign of a possible deeper correction coming up soon.
- Possible zones for correction are all the support-turned-resistance levels of above. If a correction takes place, we should expect a sharp correction to the huge decline.
- The trading volume is (still) very high – sellers with their hands on.
- BitFinex open short positions gained more and currently at 31.1K, which is the new weekly high, and starting to be interesting for a possibility of a short squeeze.
BTC/USD BitStamp 1-Hour chart
BTC/USD BitStamp 1-Day chart
Cryptocurrency charts by TradingView. Technical analysis tools by Coinigy.
SPECIAL OFFER (Sponsored)
Binance Free $600 (CryptoPotato Exclusive): Use this link to register new account and receive $600 exclusive welcome offer on Binance (
full details).
LIMITED OFFER 2024 for CryptoPotato readers at Bybit: Use this link to register and open a $500 BTC-USDT position on Bybit Exchange for free!
Disclaimer: Information found on CryptoPotato is those of writers quoted. It does not represent the opinions of CryptoPotato on whether to buy, sell, or hold any investments. You are advised to conduct your own research before making any investment decisions. Use provided information at your own risk. See Disclaimer for more information.