Following the in-depth analysis from yesterday and as mentioned before, Bitcoin is under bearish conditions or at a stage known as Capitulation.
Capitulation sounds positive (as the last market cycle) even though it can take the asset to far new lows. We remind our long-term prediction.
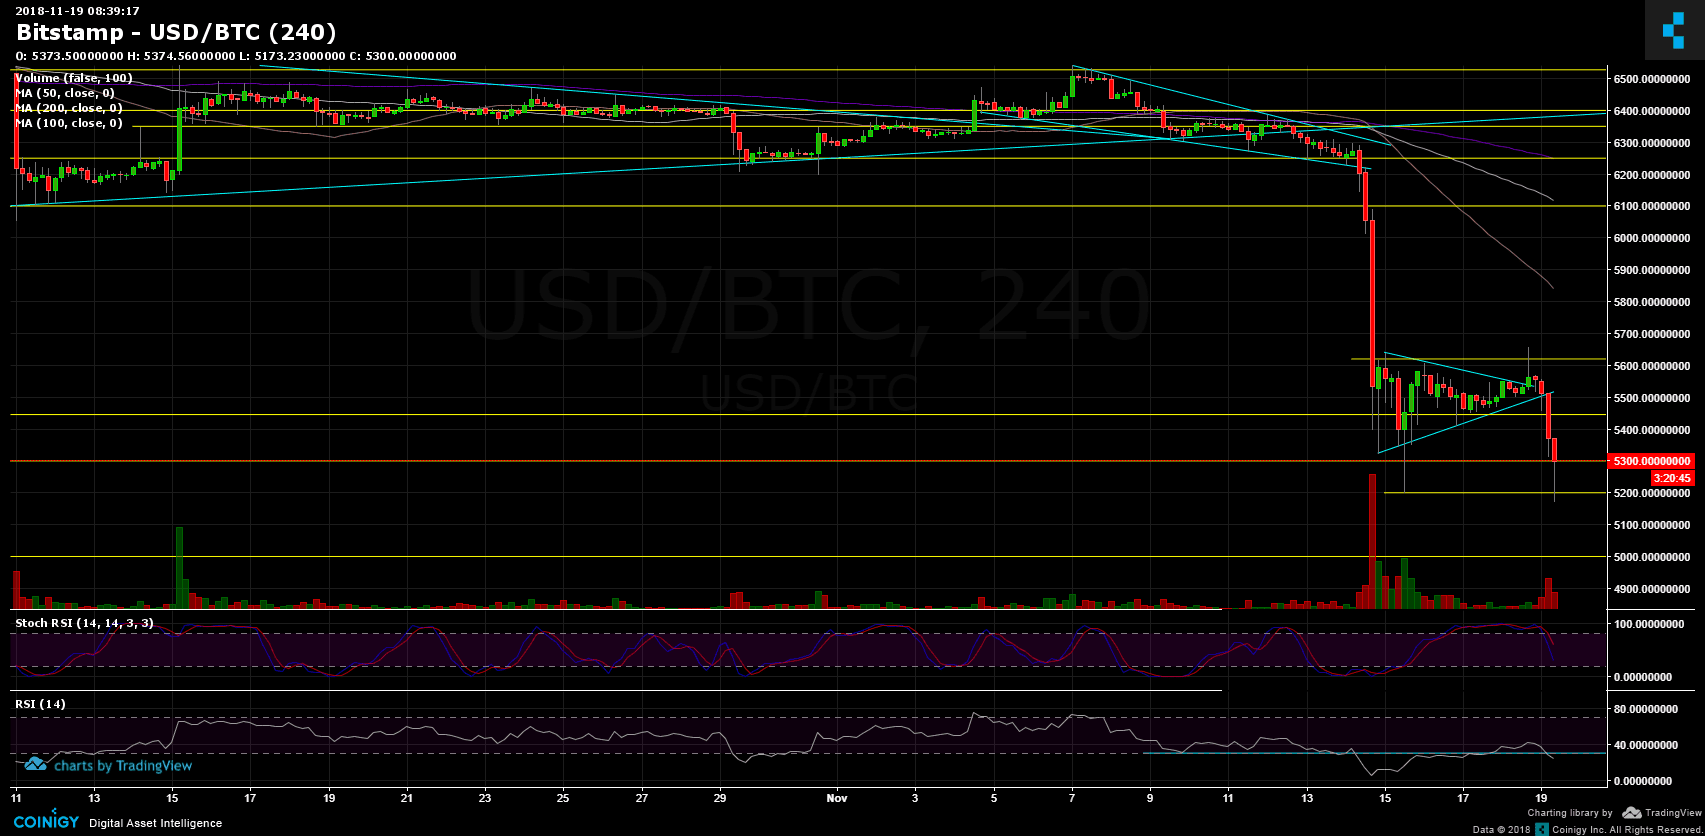
From yesterday’s analysis: “Zoom in to the current’s situation: Bitcoin is forming a symmetric triangle which it’s getting tighter and expected to break. In my opinion, the higher the chance is a breakdown. The next support area lies around $5450 and $5300.”
As we can see on the following chart, the triangle was broken down. The support level at $5300 has held for a bit, but then (during the recent hours and as I write this) another red candle came across to re-test the yearly low from November 15 at $5200 (Bitstamp).
Looking at the 4-hour chart:
- Looking at the larger time-frame, the Bitcoin daily chart: As mentioned before, the first target had been reached very quickly at $5300. The $5000 – $5300 might hold as possible support. Next possible support areas are $5000, $4500 and $3700. As we mentioned in the horror prediction – $2700 – $3000 is the possible bottom.
- Zoom in to the current’s situation: After breaking up the triangle, there are two options – the bullish one is that Bitcoin holds this current low of $5200 and forms a double bottom (a bullish form). The bearish, you can guess, is breaking down $5200 to test $5000 historic resistance.
- Resistance levels lie at $5300, $5450, ~$5650 (Fibonacci retracement level %38.2), and $5700 – $5800 area which is now support turned tough resistance. The next significant resistance lies at another support turned tough resistance – $6K.
- The RSI indicator: Another bearish sign comes from this indicator – RSI had crossed down the 30 level for the second time.
- Starting this week, the trading volume is back: High volume of sellers, which is a bearish sign.
- BitFinex open short positions jumped around 10% from yesterday to a current high of 24.5K. In their weekly high the number was 27.7K.
BTC/USD BitStamp 4-Hours chart
Cryptocurrency charts by TradingView. Technical analysis tools by Coinigy.
SPECIAL OFFER (Sponsored)
Binance Free $600 (CryptoPotato Exclusive): Use this link to register new account and receive $600 exclusive welcome offer on Binance (
full details).
LIMITED OFFER 2024 for CryptoPotato readers at Bybit: Use this link to register and open a $500 BTC-USDT position on Bybit Exchange for free!
Disclaimer: Information found on CryptoPotato is those of writers quoted. It does not represent the opinions of CryptoPotato on whether to buy, sell, or hold any investments. You are advised to conduct your own research before making any investment decisions. Use provided information at your own risk. See Disclaimer for more information.