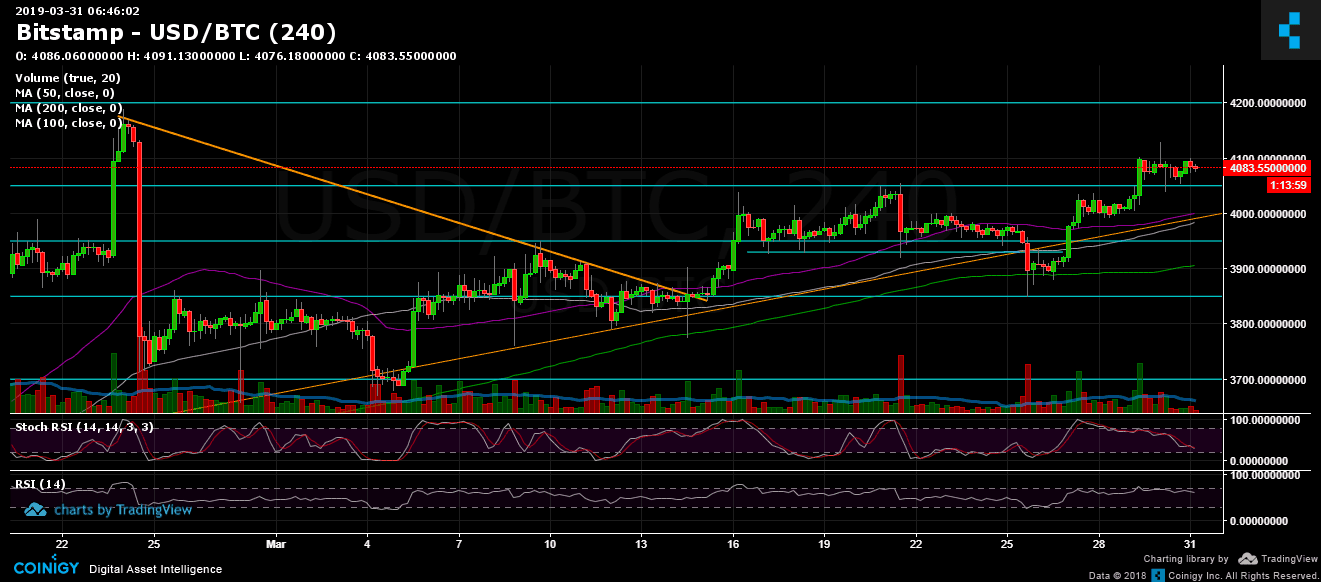
In our previous analysis, we mentioned the importance of breaking up the $4050 resistance. As of writing this, BTC has managed to maintain nearly 48 hours above that level, reaching a three-day high of $4130.
How significant is the Stochastic RSI indicating the trend: This is what we had written in our most recent analysis: “Stochastic RSI oscillator had recently crossed over in the daily chart’s oversold area. This could be a sign for the buyers to push the price to surpass $4050 finally.”
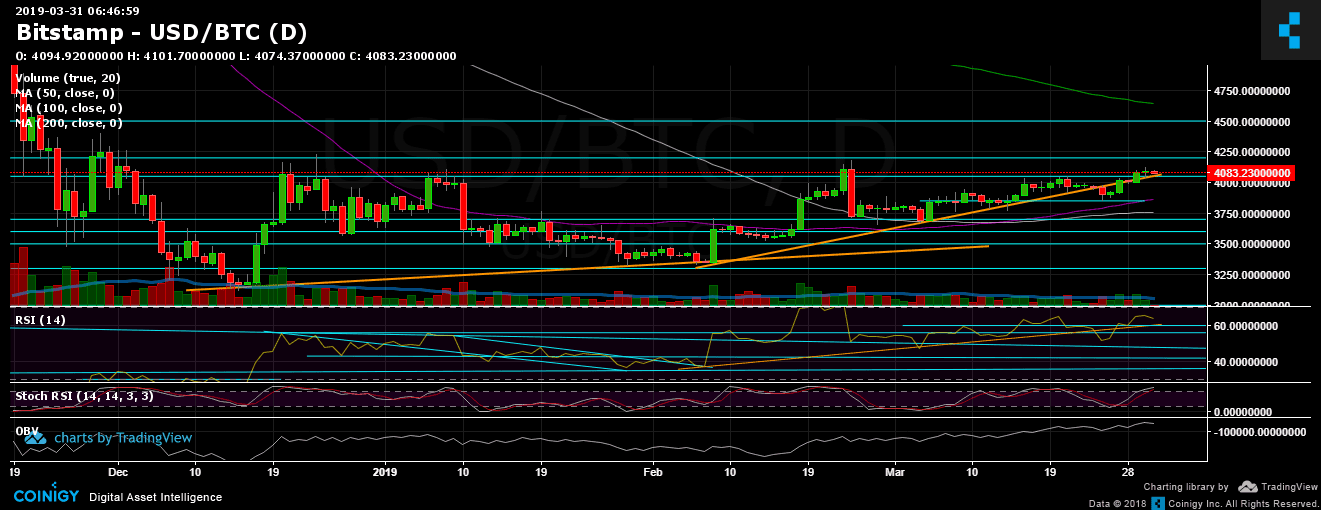
Overall, the good news is that Bitcoin is back on top of the mid-term ascending trend-line (marked in orange) of the daily chart.
The question is how much fuel is left in Bitcoin’s engines, especially since its facing high supply and resistance areas around $4200 and $4400.
Total Market Cap: $143.8 Billion
Bitcoin Market Cap: $72.2 Billion
BTC Dominance: 50.2% – Like any technical data, the 50% dominance mark should be a strong resistance level, in my opinion. It’s likely that either BTC will fire its engines or will get dumped, which will cause the altcoins, that had seen fabulous gains over the past month, to dump more whereas the dominance will raise.
– Support/Resistance:
Following the nice breakout of $4050, Bitcoin recorded a $4130 and quickly got rejected to retest $4030, this time as a support level. As long as BTC maintains the $4000 – $4030 area, we can see it targeting the next significant resistance level at $4200. It’s important to note that the last time Bitcoin was over $4200 was exactly four months ago.
Further resistance is located at $4300 and $4400 (strong), before reaching the most critical test for Bitcoin is 2019 which is the 200-days moving average line on the 1-day chart. The last is currently around $4600 and coming slowly down towards Bitcoin (the line marked in light green).
From below, the nearest support lies at the $4000 – $4050 area. Further below is $3950, before reaching the daily chart’s 50-days moving average line, along with the $3850 strong support.
– The daily chart’s RSI level: Following the breakout, the RSI is back above 60, in the bullish territory.
– The daily trading volume: As mentioned before, the amount of volume is not significant in comparison to 2019.
– BitFinex open short positions: Following the recent drop, with a minimum of 18K, the open shorts number stands at 19.4K BTC open positions.