On our previous BTC price analysis from two days ago, we mentioned the sideways action along with the anticipated move:
“The triangle should be decided along with the interaction with the significant resistance level of the 50-days moving average line from the daily chart (marked in white).
A breakout could turn out to be a very bullish move and send Bitcoin to retest next resistance levels around the $4050 – $4200 area. The following resistance level is $4400.”
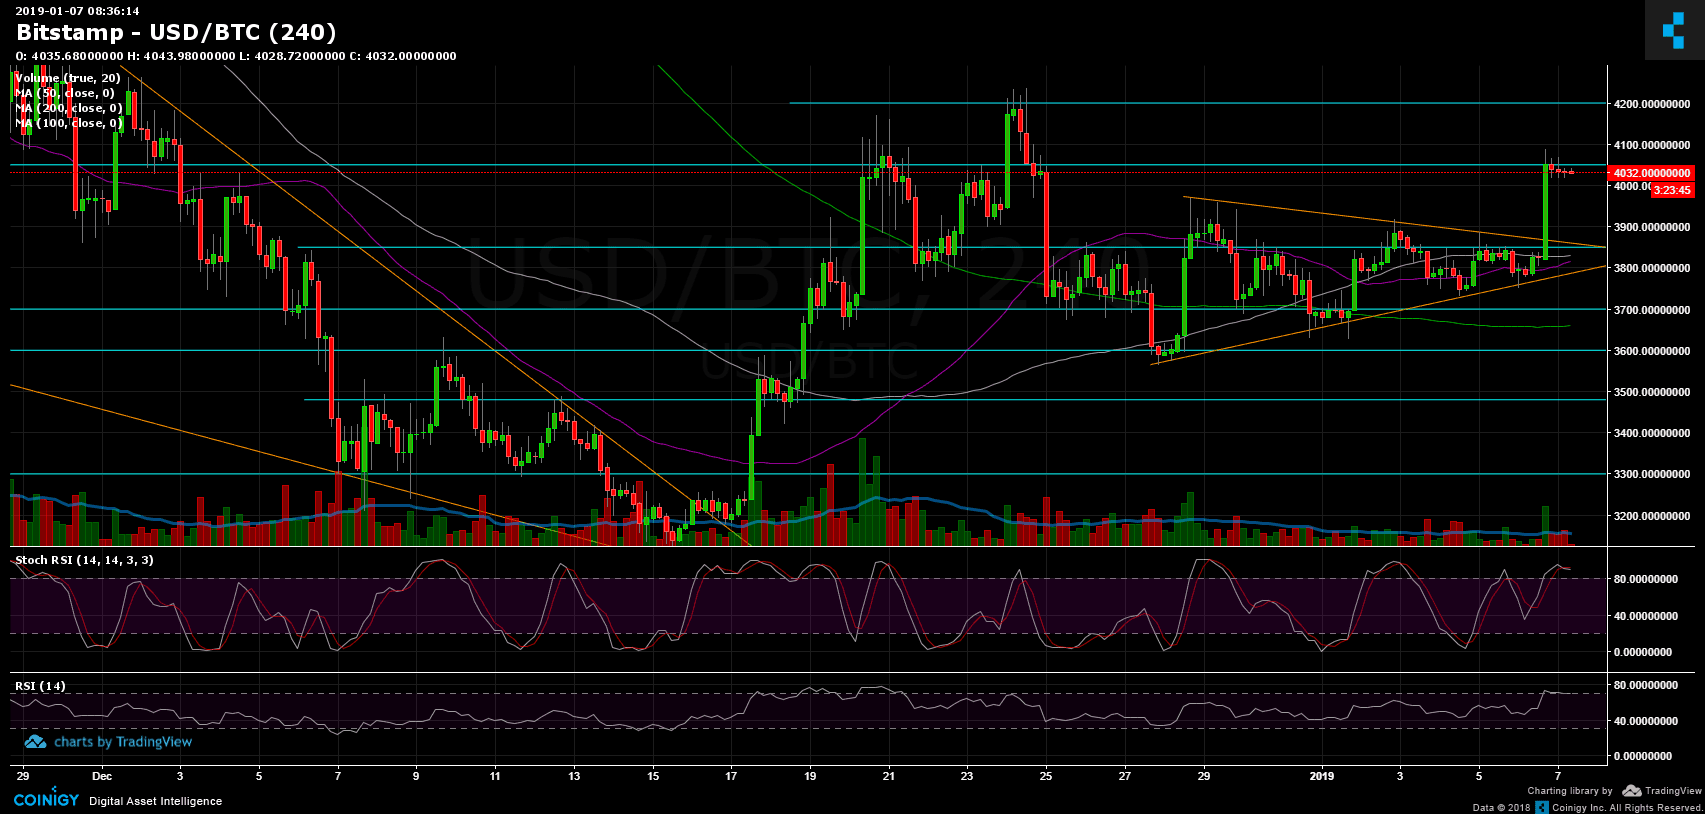
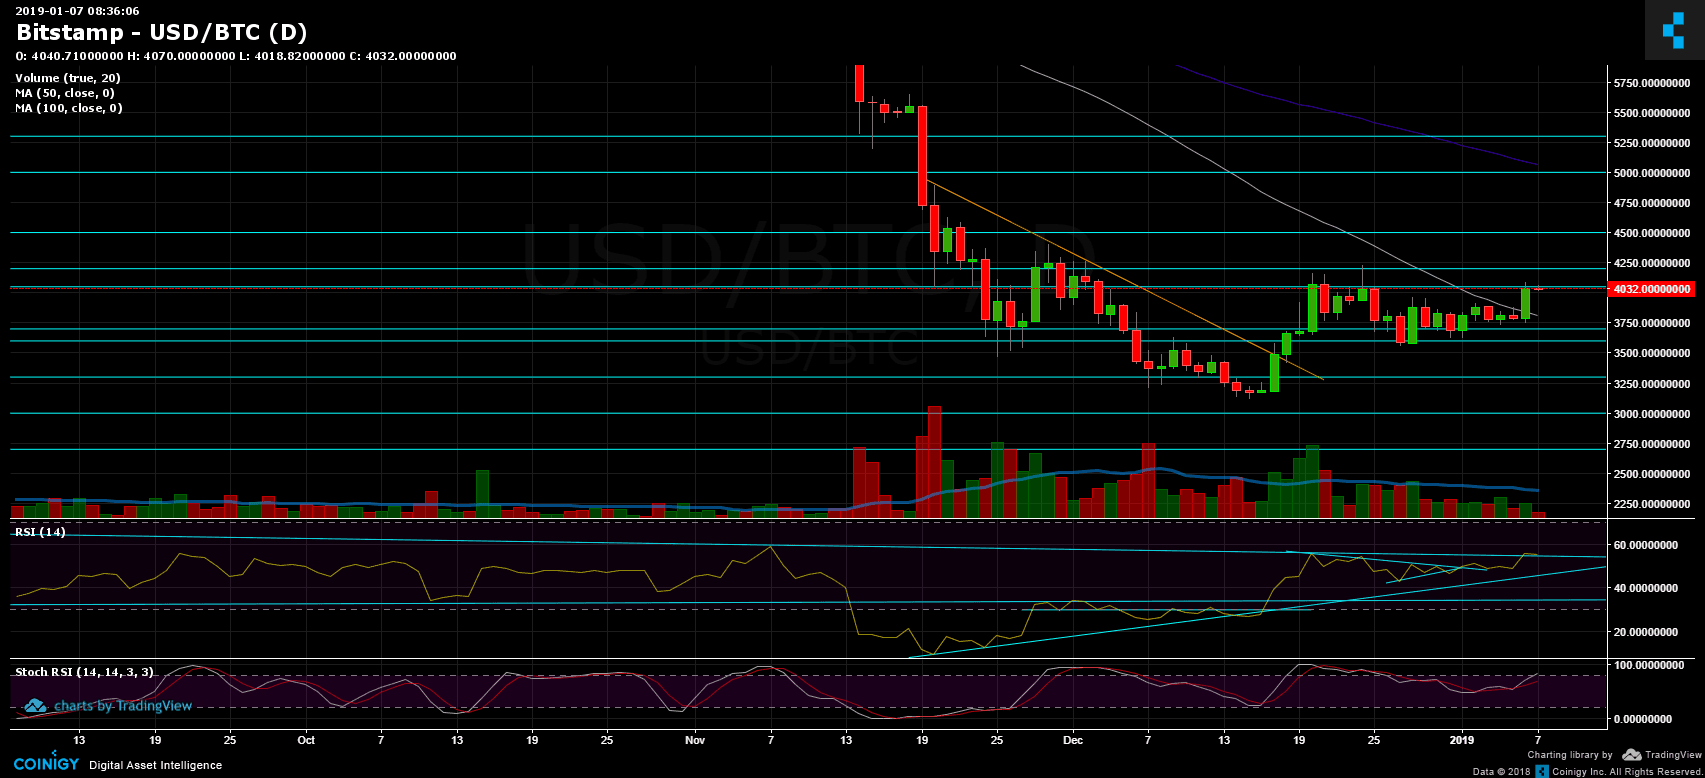
As we can see, the described scenario took place, with Bitcoin reaching a 24-hours high of $4090 (Bitstamp) as of now, following a decent breakout of the symmetric triangle along with the 50-days moving average line (from the 1-day chart).
Looking at the 1-day & 4-hour charts
- Bitcoin is now facing the $4050 well-known resistance level. We could expect the bulls to push the price even higher, to the next resistance level at $4200. Following the above, the further resistance area is $4400 – $4500.
- The bullish inverse Head and Shoulders pattern is still alive: we can expect a play-out of it in case of breaking up the $4200 area with a reasonable amount of volume. The iH&S formation could grant Bitcoin immediate targets of over $5000.
- However, following the triangle breakout, Bitcoin might need some air to continue higher, and Stochastic RSI indicator confirms it as it had crossed over in the overbought area.
- Possible support levels for correction could be $4000, $3950 and $3900. Reaching those levels will be considered as a healthy correction. The next major area of support is the $3800 – $3850 area (including 4-hour 100 and 50 days moving average lines).
- Daily Chart: The RSI level had reached the long-term descending trend-line, which could be a resistance area (this straightens the above point of a needed correction).
- What I don’t like about the recent breakout is the relatively low amount of trading volume. This could be because of the weekend, but for a possible bullish continuation, we should see a rise in the volume of buyers.
- Following our shorts report from yesterday, BitFinex’s open short positions, decreased to their lowest point since November – 24.7K BTC, while BTC long positions are still showing nice gains. BitFinex is soon going offline for servers migration, which could trigger some price action for the next hours.
BTC/USD BitStamp 4-Hour chart
BTC/USD BitStamp 1-Day chart
SPECIAL OFFER (Sponsored)
LIMITED OFFER 2024 for CryptoPotato readers at Bybit: Use this link to register and open a $500 BTC-USDT position on Bybit Exchange for free!
Disclaimer: Information found on CryptoPotato is those of writers quoted. It does not represent the opinions of CryptoPotato on whether to buy, sell, or hold any investments. You are advised to conduct your own research before making any investment decisions. Use provided information at your own risk. See Disclaimer for more information.
Cryptocurrency charts by TradingView.