Yesterday, when most of the press was glad, celebrating that huge BTC candle that reached a daily high of $3772, we had some other insights:
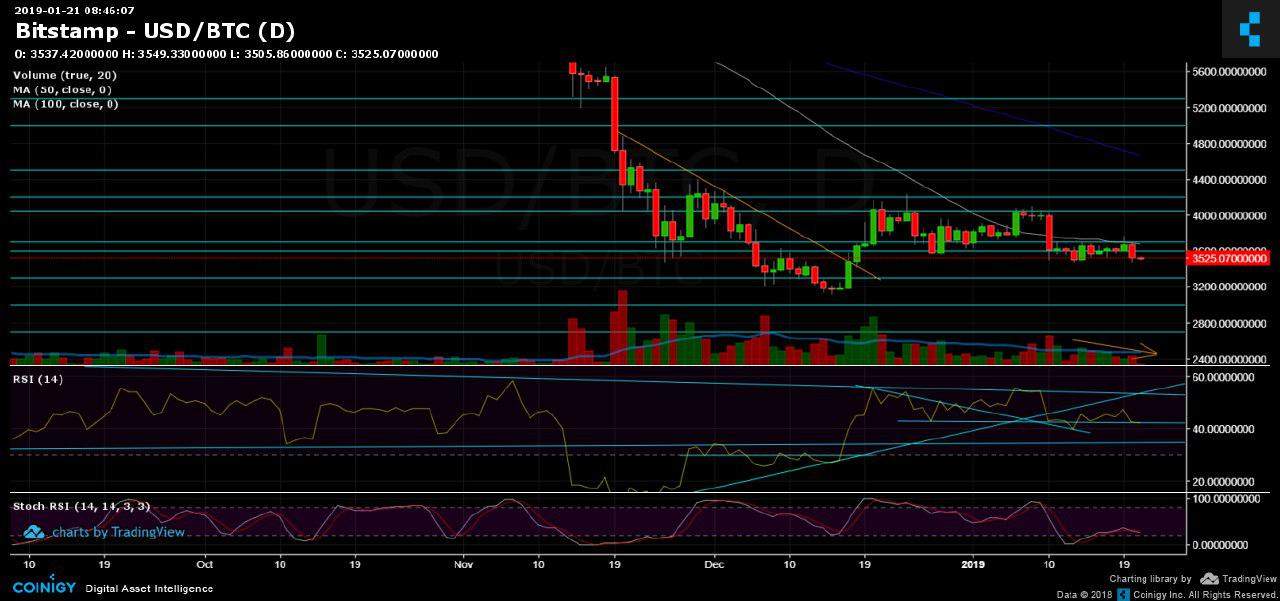
“To all the bulls, it’s too early to celebrate: The volume was pretty weak, and since the sudden unexpected positive move, Bitcoin is slowly losing momentum and currently trading below the important daily chart’s 50 days moving average line (marked in white). The daily candle structure left a long wick at its top; this is not how a breakout looks.”
Unfortunately, we were right this time. That was a complete false breakout, and all the signs, including the decreasing amount of trading volume while BTC raises, were pointing on one outcome: Bitcoin lost more than $200 in less than two hours.
Bitcoin went back to its weekly low and in just under 120 minutes returned all the past week’s gains. As been said before – A Bull Walks Up to the Steps; a Bear Jumps Out the Window.
During the past week, we’ve talked about the no-volume BTC market which has marked its range between $3500 to $3700. We’ve said that the higher chances are to break down from that range, rather than to break up. Unfortunate to the bulls, we’re getting very close to that point.
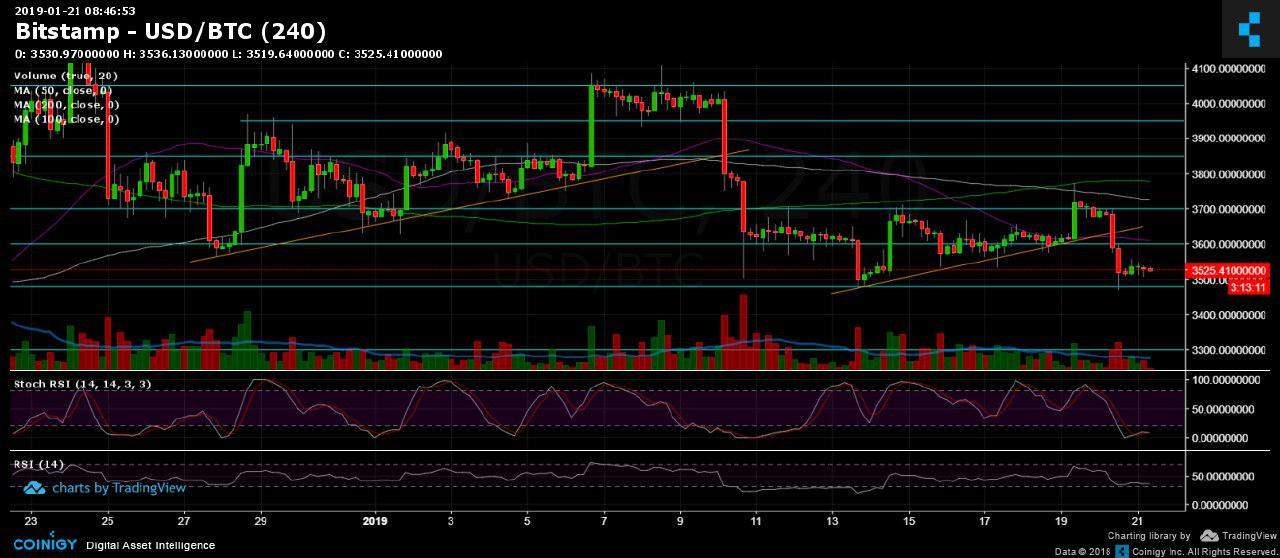
Looking at the 1-day & 4-hour charts
- The significant support levels: $3700 (along with the daily chart’s MA-50) and $3600 are gone, as of now. BTC is now facing the critical $3480 – $3500 support area. Below this crucial level, lies the $3400 (weak support) and $3300 support level. This is before retesting the 2018 low at $3120.
- However, the 4-hour Stochastic RSI had just crossed over around the oversold area. This might lead to a slight correction, maybe to retest prior support that was broken. Possible correction levels could be the $3600, along with the 4-hour chart’s 50 days moving average line. Above is the resistance turned support level of $3700, which includes the daily chart’s MA-50 (marked in white on the daily).
- This can get very ugly, following the 1-day chart Stochastic RSI oscillator crossing over to the downside. The daily chart’s RSI is currently testing a critical descending line as support. Breaking down here could introduce Bitcoin its new lower targets that were mentioned above.
- As said yesterday, Saturday’s gains were followed by a low amount of volume. However, yesterday’s trading volume was a lot higher, which teaches us, that the sellers are still here with their hands on.
- BitFinex’s open short positions hadn’t changed much, a slight decrease to 23.0K BTC of open positions.
BTC/USD BitStamp 1-Hour chart
BTC/USD BitStamp 1-Day chart
SPECIAL OFFER (Sponsored)
LIMITED OFFER 2024 for CryptoPotato readers at Bybit: Use this link to register and open a $500 BTC-USDT position on Bybit Exchange for free!
Disclaimer: Information found on CryptoPotato is those of writers quoted. It does not represent the opinions of CryptoPotato on whether to buy, sell, or hold any investments. You are advised to conduct your own research before making any investment decisions. Use provided information at your own risk. See Disclaimer for more information.
Cryptocurrency charts by TradingView.