When you don’t break up, you lose momentum, then quickly lose stability and break down. As we all know, Bitcoin is a volatile asset. Maybe the most volatile around.
Over the past days, Bitcoin was trying to breach the $4050 major resistance mark. The buyers became weaker and weaker till they lost in the battle and we’ve just seen an ugly red candle back down to the $3800 area.
If this reminds of some pattern, it must be the so-called Bart Simpson’s head. Another “Bart” to the collection.
A point worth mention is the amount of open short positions. We’ve pointed out here that the shorts are nearing their lowest point since the middle of November last year. As we said here before when shorts are at their bottom expect a long squeeze. When shorts are near their top, expect a short squeeze. Simple as that.
The shorts reached their closest point (22K) to the low of November 14 (19.5K). We all remember that horrible day, the last day we’ve seen Bitcoin above $6000.
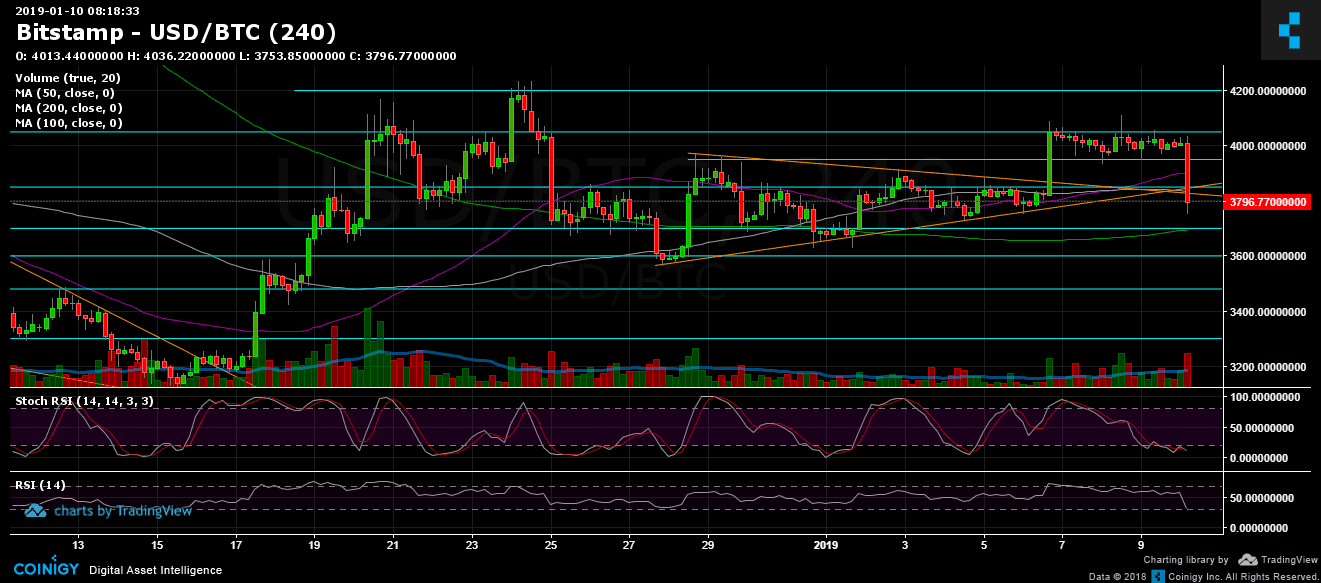
Looking at the 1-day & 4-hour charts
- Bitcoin loves Barts. The left side of the head that was created four days ago has now produced the right side of Bart’s head.
- This current right side of Bart’s head, the 4-hour candle, is critical for the continuation of Bitcoin, and specifically for the bulls, it’s crucial to close the current candle above $3830 (the ascending line) or at least above the support level of $3800.
- The next support levels are at $3800 (current area), $3700 (strong support along with the 200-days moving average line), $3600 and $3550. Below $3500, Bitcoin would be likely to re-test the $3000 area again.
- After the strong move down, Stochastic RSI oscillator is at its low. Hence, we can expect some correction to the upper side. Possible resistance levels could be $3900 (50 days moving average line) and $3950.
- The Daily Chart: The RSI level had reached the long-term descending trend-line, after trying to break it up, it had failed and got rejected down. As of now, the RSI is testing the ascending trend-line and could find support here.
- As mentioned here before, the last incline was followed by a weak amount of With not much buyers’ volume Bitcoin can’t reach new highs.
- After recording a low of 22.3K, BitFinex’s open short positions increased a bit to 22.5K. This is still considered a low amount of open short positions. However, we did notice the long squeeze: The open long positions went down from 34K to 31K during the past hours.
BTC/USD BitStamp 4-Hour chart
BTC/USD BitStamp 1-Day chart
SPECIAL OFFER (Sponsored)
Binance Free $600 (CryptoPotato Exclusive): Use this link to register new account and receive $600 exclusive welcome offer on Binance (
full details).
LIMITED OFFER 2024 for CryptoPotato readers at Bybit: Use this link to register and open a $500 BTC-USDT position on Bybit Exchange for free!
Disclaimer: Information found on CryptoPotato is those of writers quoted. It does not represent the opinions of CryptoPotato on whether to buy, sell, or hold any investments. You are advised to conduct your own research before making any investment decisions. Use provided information at your own risk. See Disclaimer for more information.
Cryptocurrency charts by TradingView.