CryptoPotato
CryptoPotato
  • Crypto News
  • Margin Trading
  • Guides
    • Bitcoin & Crypto Guides 101
    • Bitcoin For Beginners
    • Editorials
  • DeFi & NFT
  • Buy
  • Language
    • Spanish
    • Turkish
    • German
    • Bulgarian
  • Crypto News
  • Bitcoin For Beginners
  • Cryptocurrency Guides 101
  • Editorials
  • Bitcoin & Crypto Margin Trading
  • DeFi & NFT News
  • Bitcoin Price Analysis
  • Ethereum (ETH) Price Analysis
  • Ripple (XRP) Price Analysis
  • Market Updates
  • Interviews
  • Buy Bitcoin with Card
  • CryptoPotato Spanish
  • CryptoPotato Turkey
  • CryptoPotato Germany
  • CryptoPotato Bulgaria
  • Market Updates
  • BTC Analysis
  • ETH Analysis
  • XRP Analysis
  • Interviews
CryptoPotato
CryptoPotato
  • Crypto News
  • Margin Trading
  • Guides
    • Bitcoin & Crypto Guides 101
    • Bitcoin For Beginners
    • Editorials
  • DeFi & NFT
  • Buy
  • Language
    • Spanish
    • Turkish
    • German
    • Bulgarian
  • Crypto News
  • Bitcoin For Beginners
  • Cryptocurrency Guides 101
  • Editorials
  • Bitcoin & Crypto Margin Trading
  • DeFi & NFT News
  • Bitcoin Price Analysis
  • Ethereum (ETH) Price Analysis
  • Ripple (XRP) Price Analysis
  • Market Updates
  • Interviews
  • Buy Bitcoin with Card
  • CryptoPotato Spanish
  • CryptoPotato Turkey
  • CryptoPotato Germany
  • CryptoPotato Bulgaria
Home » BTC » Bitcoin Price Analysis: Is This The Day Bitcoin Had Been Waiting For 11 Years?

Bitcoin Price Analysis: Is This The Day Bitcoin Had Been Waiting For 11 Years?

Author: Yuval Gov

Last Updated Mar 19, 2020 @ 23:05
Getting your audio player ready...

Quick recap: for the past few weeks, Bitcoin had been following the crashing global markets. While the S&P 500 and Nasdaq lost more than 30% over the past month, Bitcoin followed them but with a little bit of leverage.

The primary cryptocurrency is now trading at a 50% discount from the highs of mid-February, when it was trading above the $10,000 mark.

Many crypto enthusiasts waited for this moment. Bitcoin was born after the most recent significant financial crisis, the one of 2008. Nowadays, Bitcoin is facing its first real economic collapse, but so far, behaving just like any other asset. Not the way Satoshi Nakamoto expected it to be.

Turning Point For BTC?

We could see the same positive correlation between Bitcoin and the stock markets over the past weeks. However, during the previous days, Bitcoin holds firmly, trading inside a range between $5000 and $5500. This is despite another plunge of 5-6% in the major indexes.

Is this the turning point, when Bitcoin says goodbye to the positive correlation in order to become a real safe-haven asset? Only time will tell. Just a reminder, Gold crashed at the beginning of the 2008 financial crisis, just as it does now, before starting to be a hedge and started soaring.

correlation_BTC_SP_2-min
BTC (blue) Vs. S&P500 (orange) over the past days. Correlation fading away?


UPDATE, March 19, 19:30: The Breakout

Following yesterday’s assumption about Bitcoin being stable against the crashing markets, we saw Bitcoin breaking above the $5500 resistance, followed by a massive move surpassing $6,000, marking $6,400 as the current daily high, as of writing these lines. Click here for the most updated Bitcoin price analysis.

While Bitcoin was breaking out, Wall Street futures were forecasting a 2-3% drop at the start of Thursday’s trading day. Judging by the past hours, the correlation between Bitcoin and the markets is now inverse. A dream come true? Only time will tell.

Crypto Market Data

Total Market Cap: $172 billion

Bitcoin Market Cap: $112 billion

BTC Dominance Index: 64.8%

*Data by CoinGecko

Key Levels To Watch & Next Possible Targets

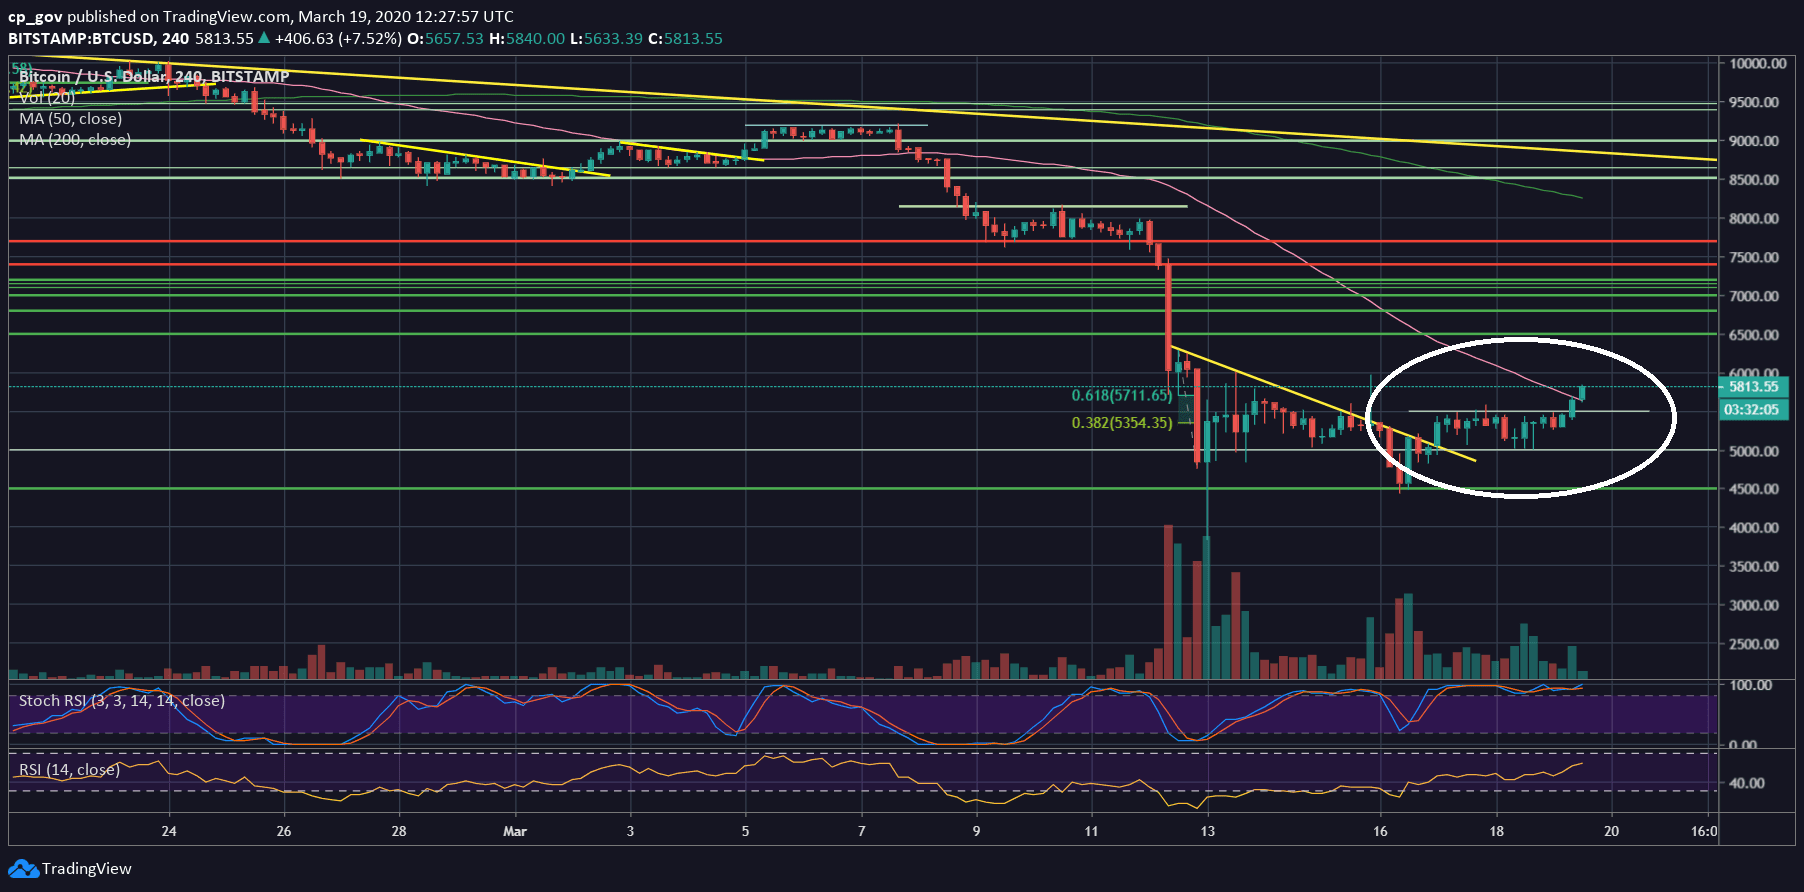
– Support/Resistance levels: As mentioned above, the overall picture can be seen on the 4-hour chart below. Bitcoin is trading between $5000 from below, and $5500 from above. A breakout to either direction is likely to point the next short-term for Bitcoin.

From above, the first resistance is the $5500 price zone (the 78.6% Fib retracement level from the June 2019 bull-run), followed by $5700. Further above lies $6000 – $6100 (Sunday’s high).

From below, the first major level of support is the $5000 mark. Further below lies $4700 – $4800. Beneath, there is the Monday’s low around $4500, before the next significant level at $4200 (old resistance turned support level from the beginning of 2019), and the $4000 mark.

– The RSI Indicator: The RSI is at a decision point. After breaking out of the marked wedge, which started forming a month ago, the RSI is facing the 30 level as resistance. A break here can boost the bulls.

– Trading volume: As mentioned here before, Thursday and Friday, March 12 & 13, were the two highest daily volume candles over the past year. Since then, the volume had been declining, getting ready for the next move.

BTC/USD BitStamp 4-Hour Chart (Updated Mar.19 12:30 UTC)

btc_mar19_4h_v2-min-min

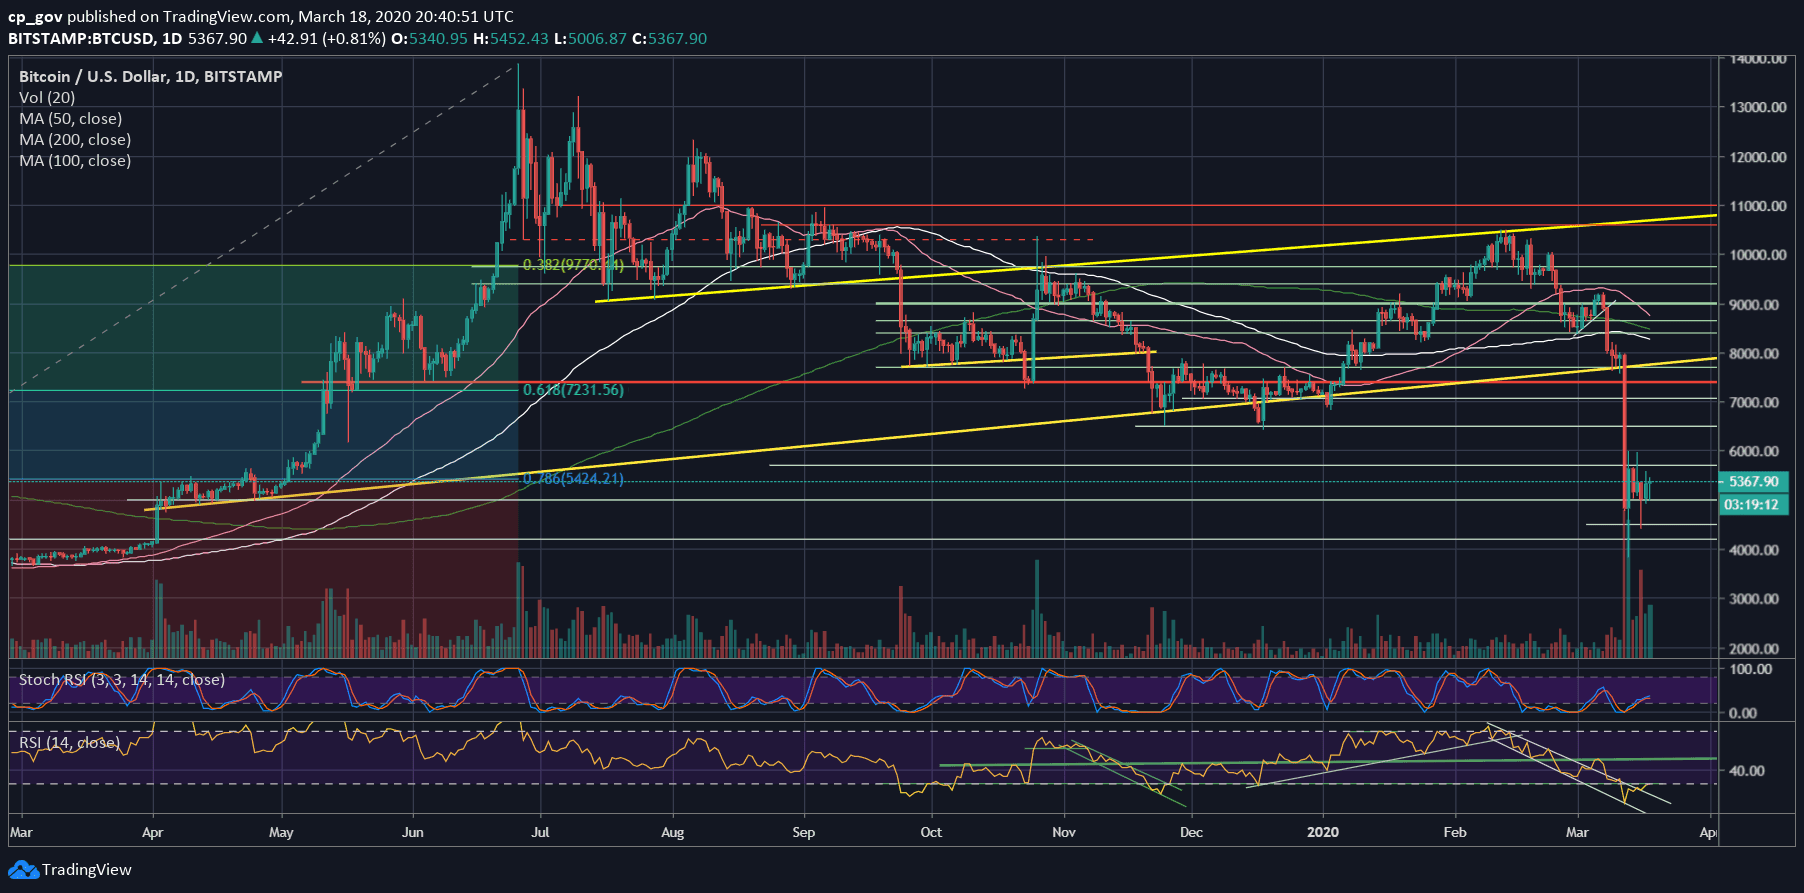
BTC/USD BitStamp 1-Day Chart

btc_mar18_d-min

SPECIAL OFFER (Sponsored)
Binance Free $600 (CryptoPotato Exclusive): Use this link to register a new account and receive $600 exclusive welcome offer on Binance (full details).

LIMITED OFFER for CryptoPotato readers at Bybit: Use this link to register and open a $500 FREE position on any coin!


Disclaimer: Information found on CryptoPotato is those of writers quoted. It does not represent the opinions of CryptoPotato on whether to buy, sell, or hold any investments. You are advised to conduct your own research before making any investment decisions. Use provided information at your own risk. See Disclaimer for more information.

Cryptocurrency charts by TradingView.
Tags: Bitcoin (BTC) Price Bitcoin Long-Term Prediction
Enjoy reading? Share with your friends
Facebook Twitter LinkedIn Telegram

About The Author

Yuval Gov
More posts by this author

Yuval Gov has over 15 years of trading experience in the stock exchange, graduated from TAU - Economics and Management. Fell in love with the crypto space. Does Crossfit to get away from FOMO. Contact Yuval: LinkedIn

Join Our Community

FacebookX YouTubeTelegram


Editorials
5 Best Meme Coin Presales to Watch in May 2025

5 Best Meme Coin Presales to Watch in May 2025

Toobit Review 2025: Is Toobit a Safe Crypto Exchange?

Toobit Review 2025: Is Toobit a Safe Crypto Exchange?

Hyperliquid Bridge: How to Bridge USDC to Hyperliquid

Hyperliquid Bridge: How to Bridge USDC to Hyperliquid

11 Best Crypto Presales to Consider in May 2025

11 Best Crypto Presales to Consider in May 2025

Need for Speed – Only Ultra-Fast Blockchains Will Win the Adoption Race (Opinion)

Need for Speed – Only Ultra-Fast Blockchains Will Win the Adoption Race (Opinion)

The 5 Best Bitcoin Mining Pools in 2025: Complete Guide

The 5 Best Bitcoin Mining Pools in 2025: Complete Guide

The 5 Best Crypto Staking Platforms in 2025: Everything You Need to Know

The 5 Best Crypto Staking Platforms in 2025: Everything You Need to Know

Join Our Newsletter
Become a CryptoPotato VIP
One Weekly Email Can Change Your Crypto Life.
Sign-up FREE to receive our extended weekly market update and coin analysis report
We NEVER send spam. You can unsubscribe at any time.
Invalid email address
Thanks for subscribing!
Footer Logo
About
Advertise on CryptoPotato
About Us | Contact Us | Careers
Editorial Policy
Terms of service | Privacy Policy | GDPR
More Sections
IEO List | Evaluations
Airdrops
Scholarship
Disclaimer
Disclaimer: Information found on CryptoPotato is those of writers quoted. It does not represent the opinions of CryptoPotato on whether to buy, sell, or hold any investments. You are advised to conduct your own research before making any investment decisions. Use provided information at your own risk. Full disclaimer
© Copyright CryptoPotato 2016 - 2025
Scroll to top
One Daily Email Can Change Your Crypto Life.

Sign-up FREE to receive our extended daily market update and coin analysis report

We never send SPAM. You can unsubscribe at any moment
Invalid email address
Thanks for subscribing!