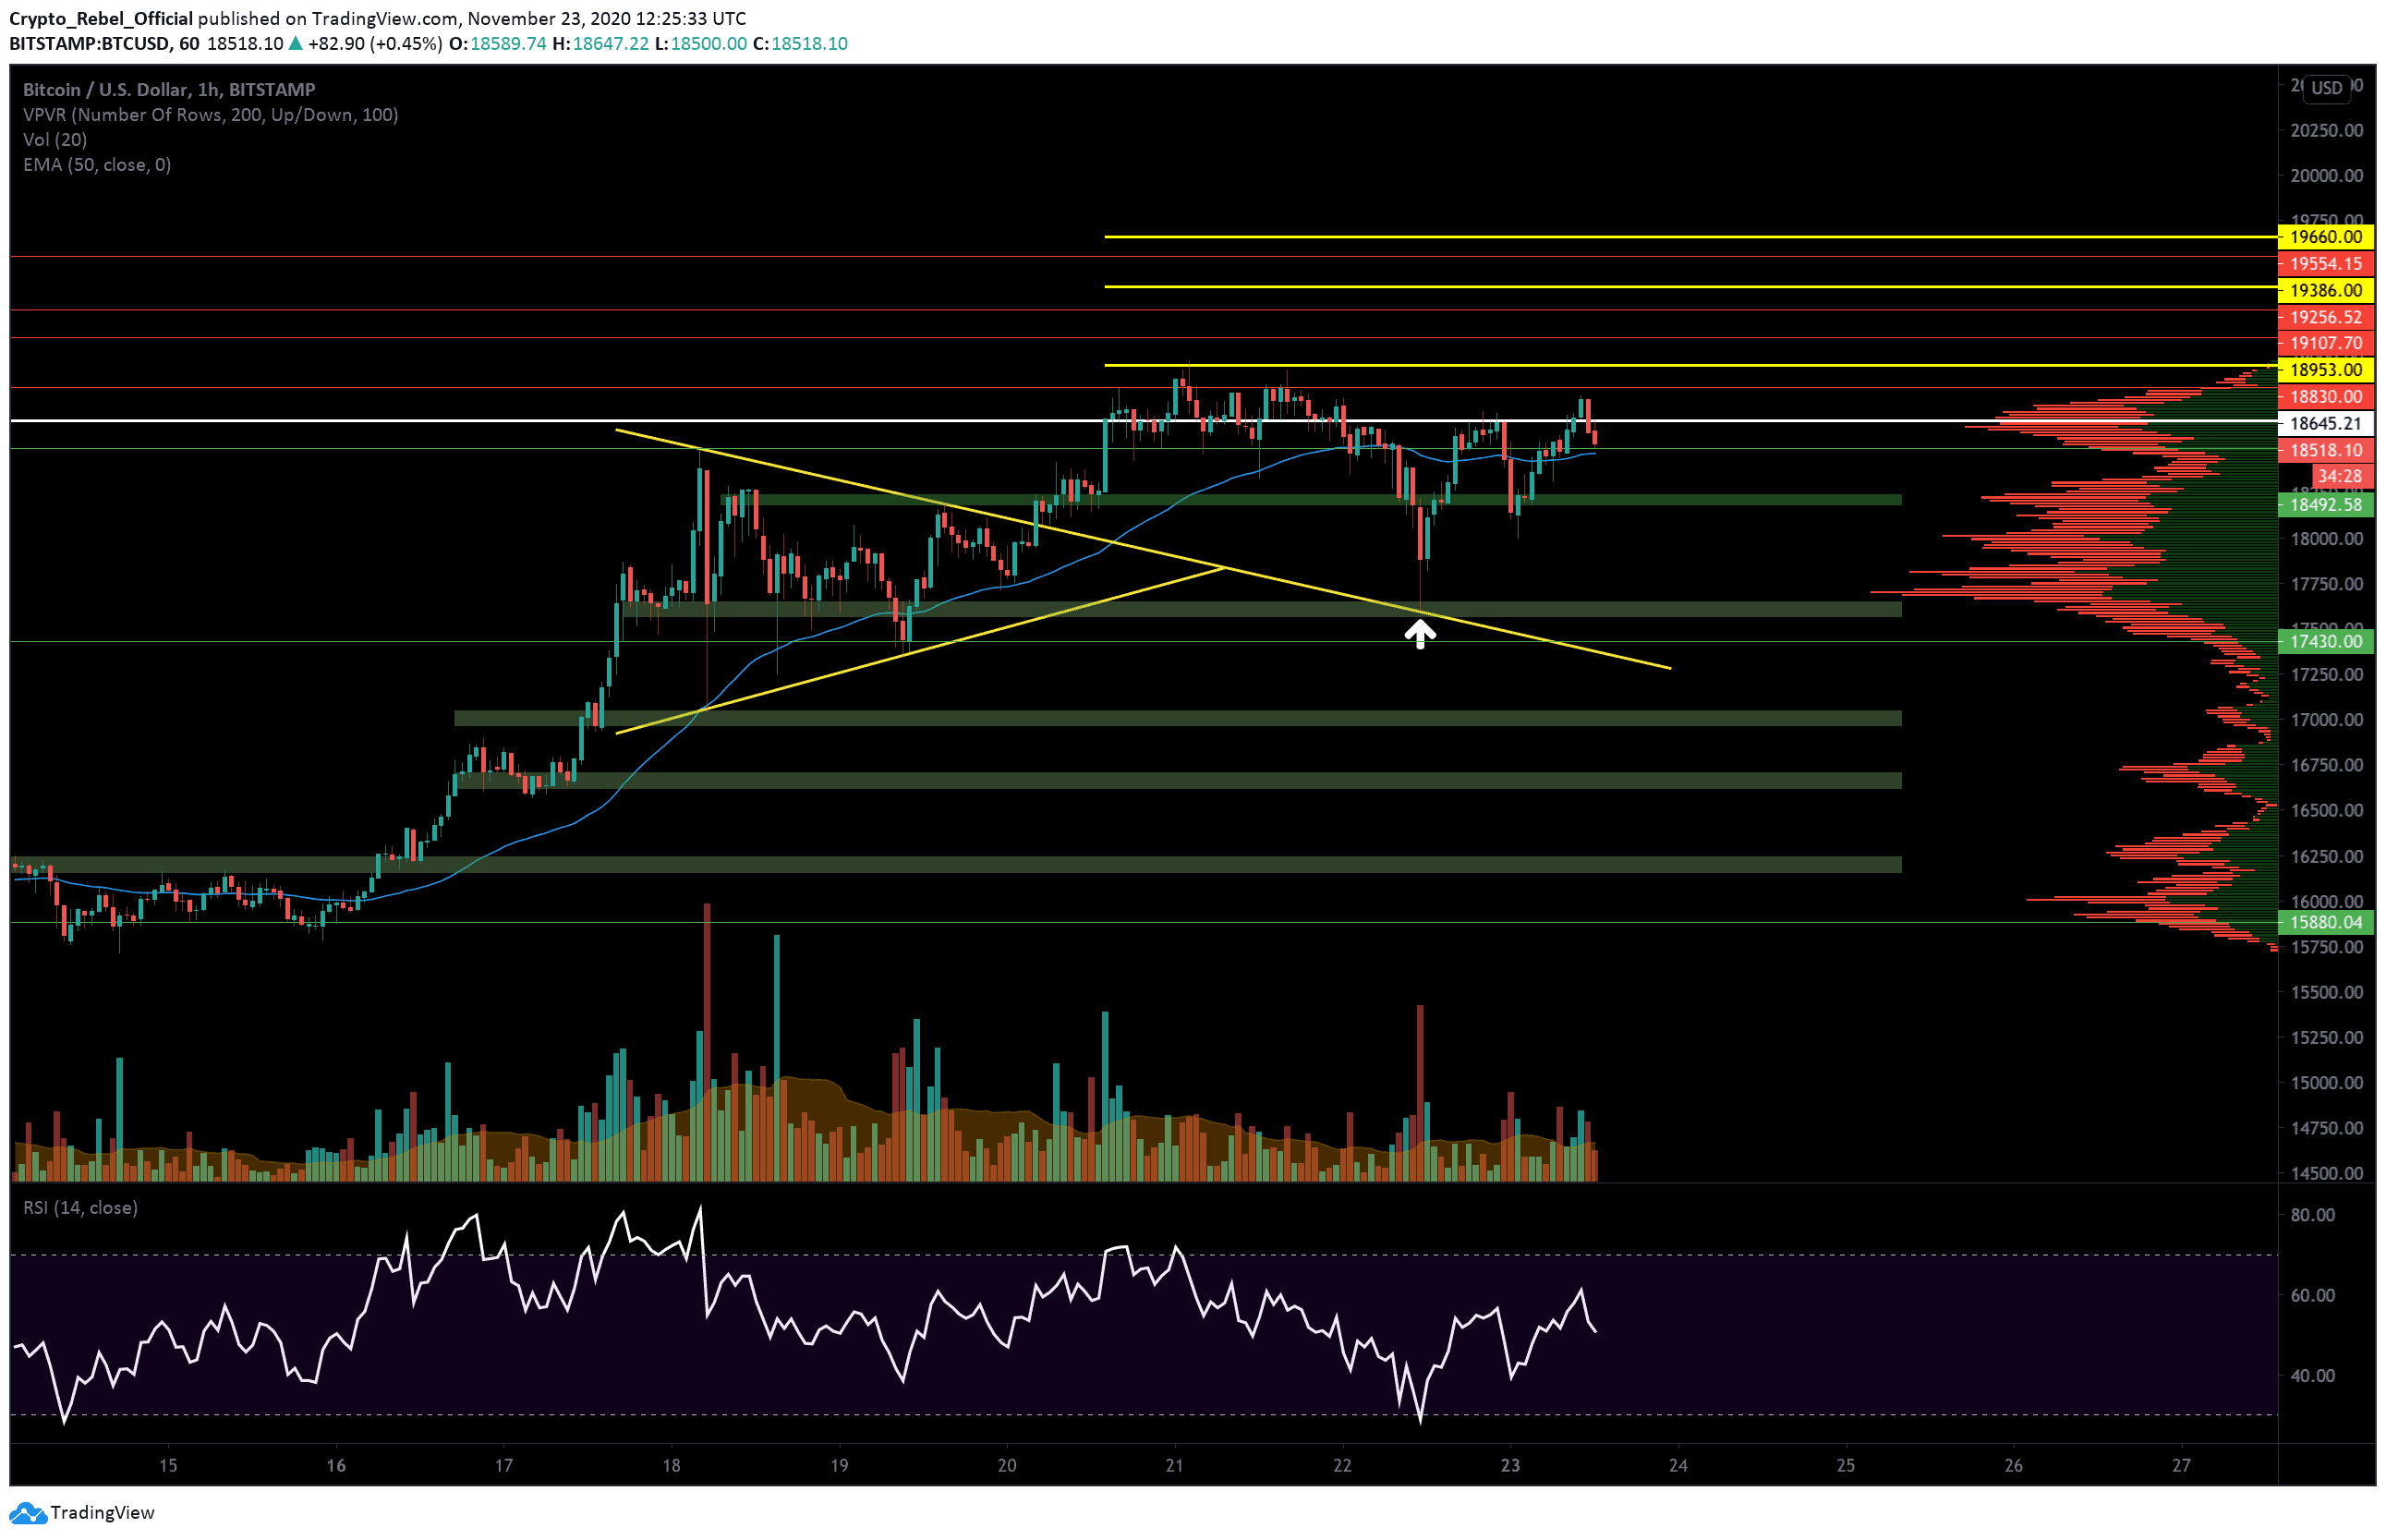
BTC/USD chart via Tradingview
Bitcoin bulls have managed to buy up another dip today after prices slumped $650 during the morning’s early hours. This is the second significant price crash to have taken place over the last 48 hours, with BTC tumbling $1,000 yesterday to a low of $17,600 before correcting (marked by a white arrow on the following chart).
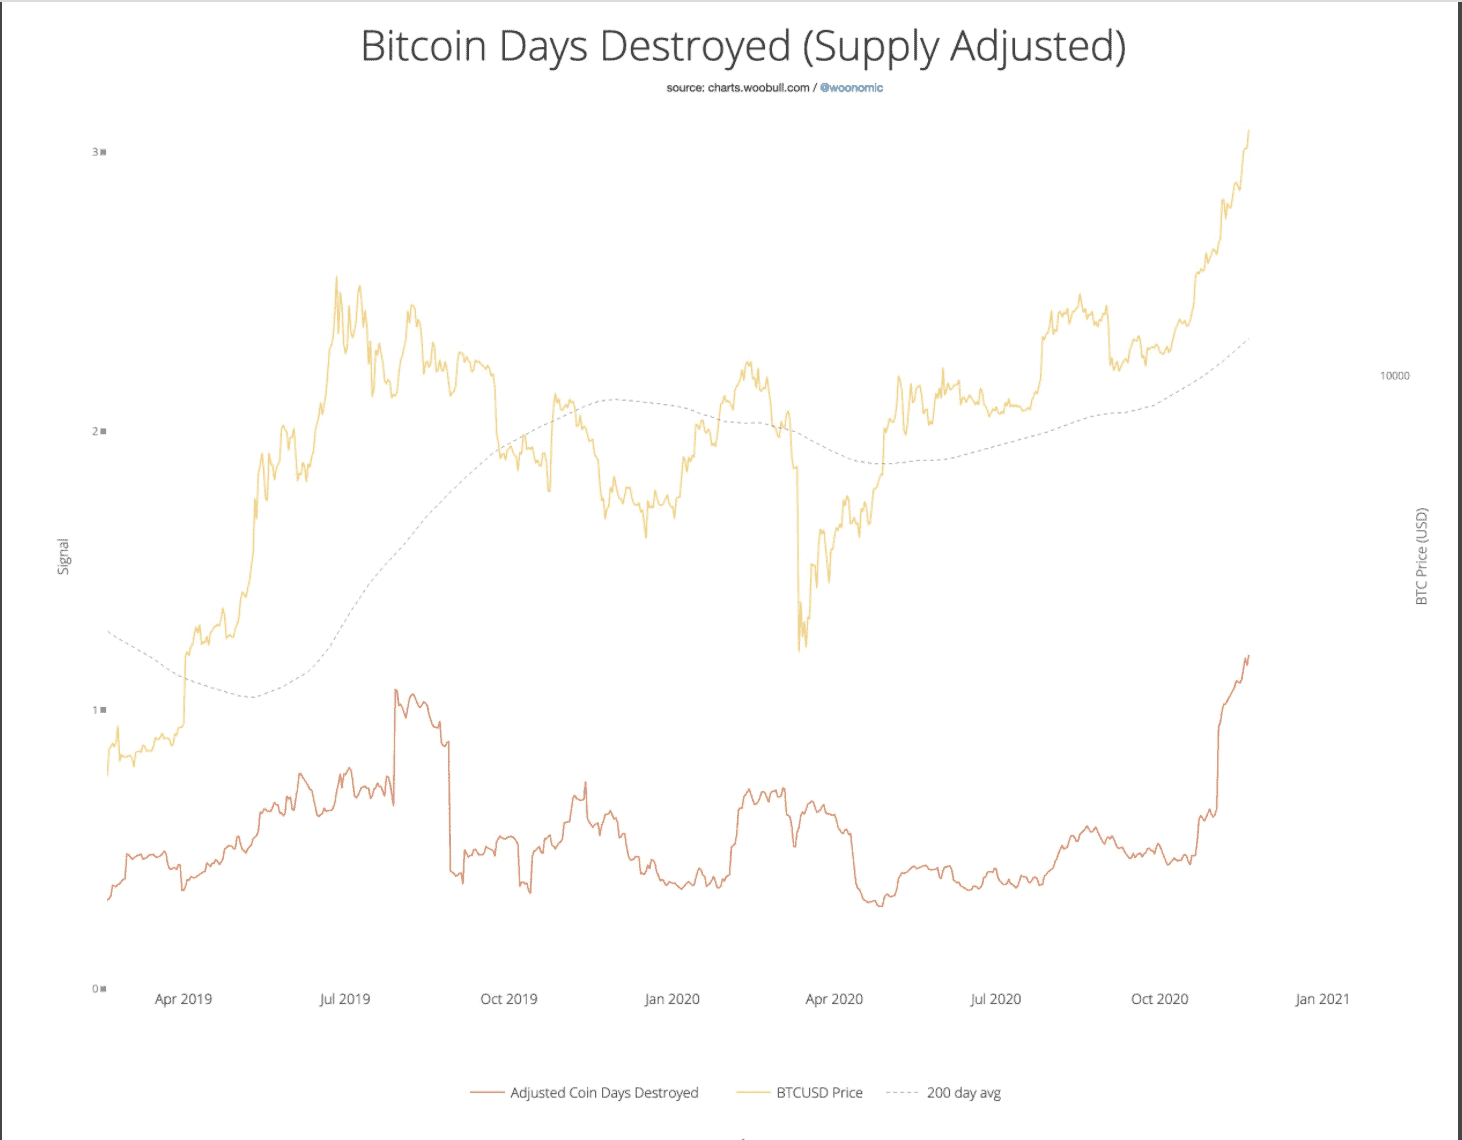
According to popular crypto analyst Willy Woo, there has been a substantial spike in the number of ‘Bitcoin days destroyed’ recently. This refers to the number of bitcoins that are being moved and sold as opposed to being HODL’ed.
When there’s a rise in the destruction of ‘Bitcoin days’ it likely signals that an increasing amount of long-term holders are dumping their coins onto the market. Woo says this could be construed as a warning that the Bitcoin market is ‘overheated’ right now despite all the promising news circulating about the leading cryptocurrency.
Is this an early warning that smart money is offloading their bags before a serious correction?
On the 1-hour BTC/USD chart, we can see that the $18,645 level plays an important role as a key S/R point for BTC prices (thick white line). As of now, Bitcoin has closed under the line and is heading towards the first support beneath at $18,490 (green line). This particular support is being reinforced by the hourly 50-EMA (blue line).
If the down-trend continues, we should expect additional areas of support at the following levels:
(1) $18,230 – first major support zone (top green bar).
(2) $17,600 – second support zone (lower green bar). This level overlapped with the extended resistance of the former bullish pennant pattern (yellow line) which ended up catching the bottom of the $1,000 weekend crash.
(3) $17,430 – key S/R level.
(4) $17,000 – psychological level and order block support.
(5) $16,700- $16,600 – major support zone.
Underneath that, we also have the last green bar support zone around $16,200 and a key S/R line at $15,880 (green line).
Looking above, there are a number of overhead resistances that will likely see reactions if bullish traders manage to regain momentum and continue their surge towards Bitcoin’s all-time high.
(1) $18,830 – key short-term resistance.
(2) $18,953 – Bitcoin’s highest weekly close. (first thick yellow line)
(3) $19,107– Key 4-hour level from December 2017.
(4) $19,256 – Another key 4-hour level from December 2017.
(5) $19,380 – Daily high from December 2017. (second thick yellow line)
Above those, there is also the $19,554 (top thin red line) and the all-time high at $19,660 (the top-thick yellow line) which will likely act as resistance levels if prices break that high.