BTC/USD chart via Tradingview
Bitcoin price is soaring right now as the US legacy market opens up to begin the new week.
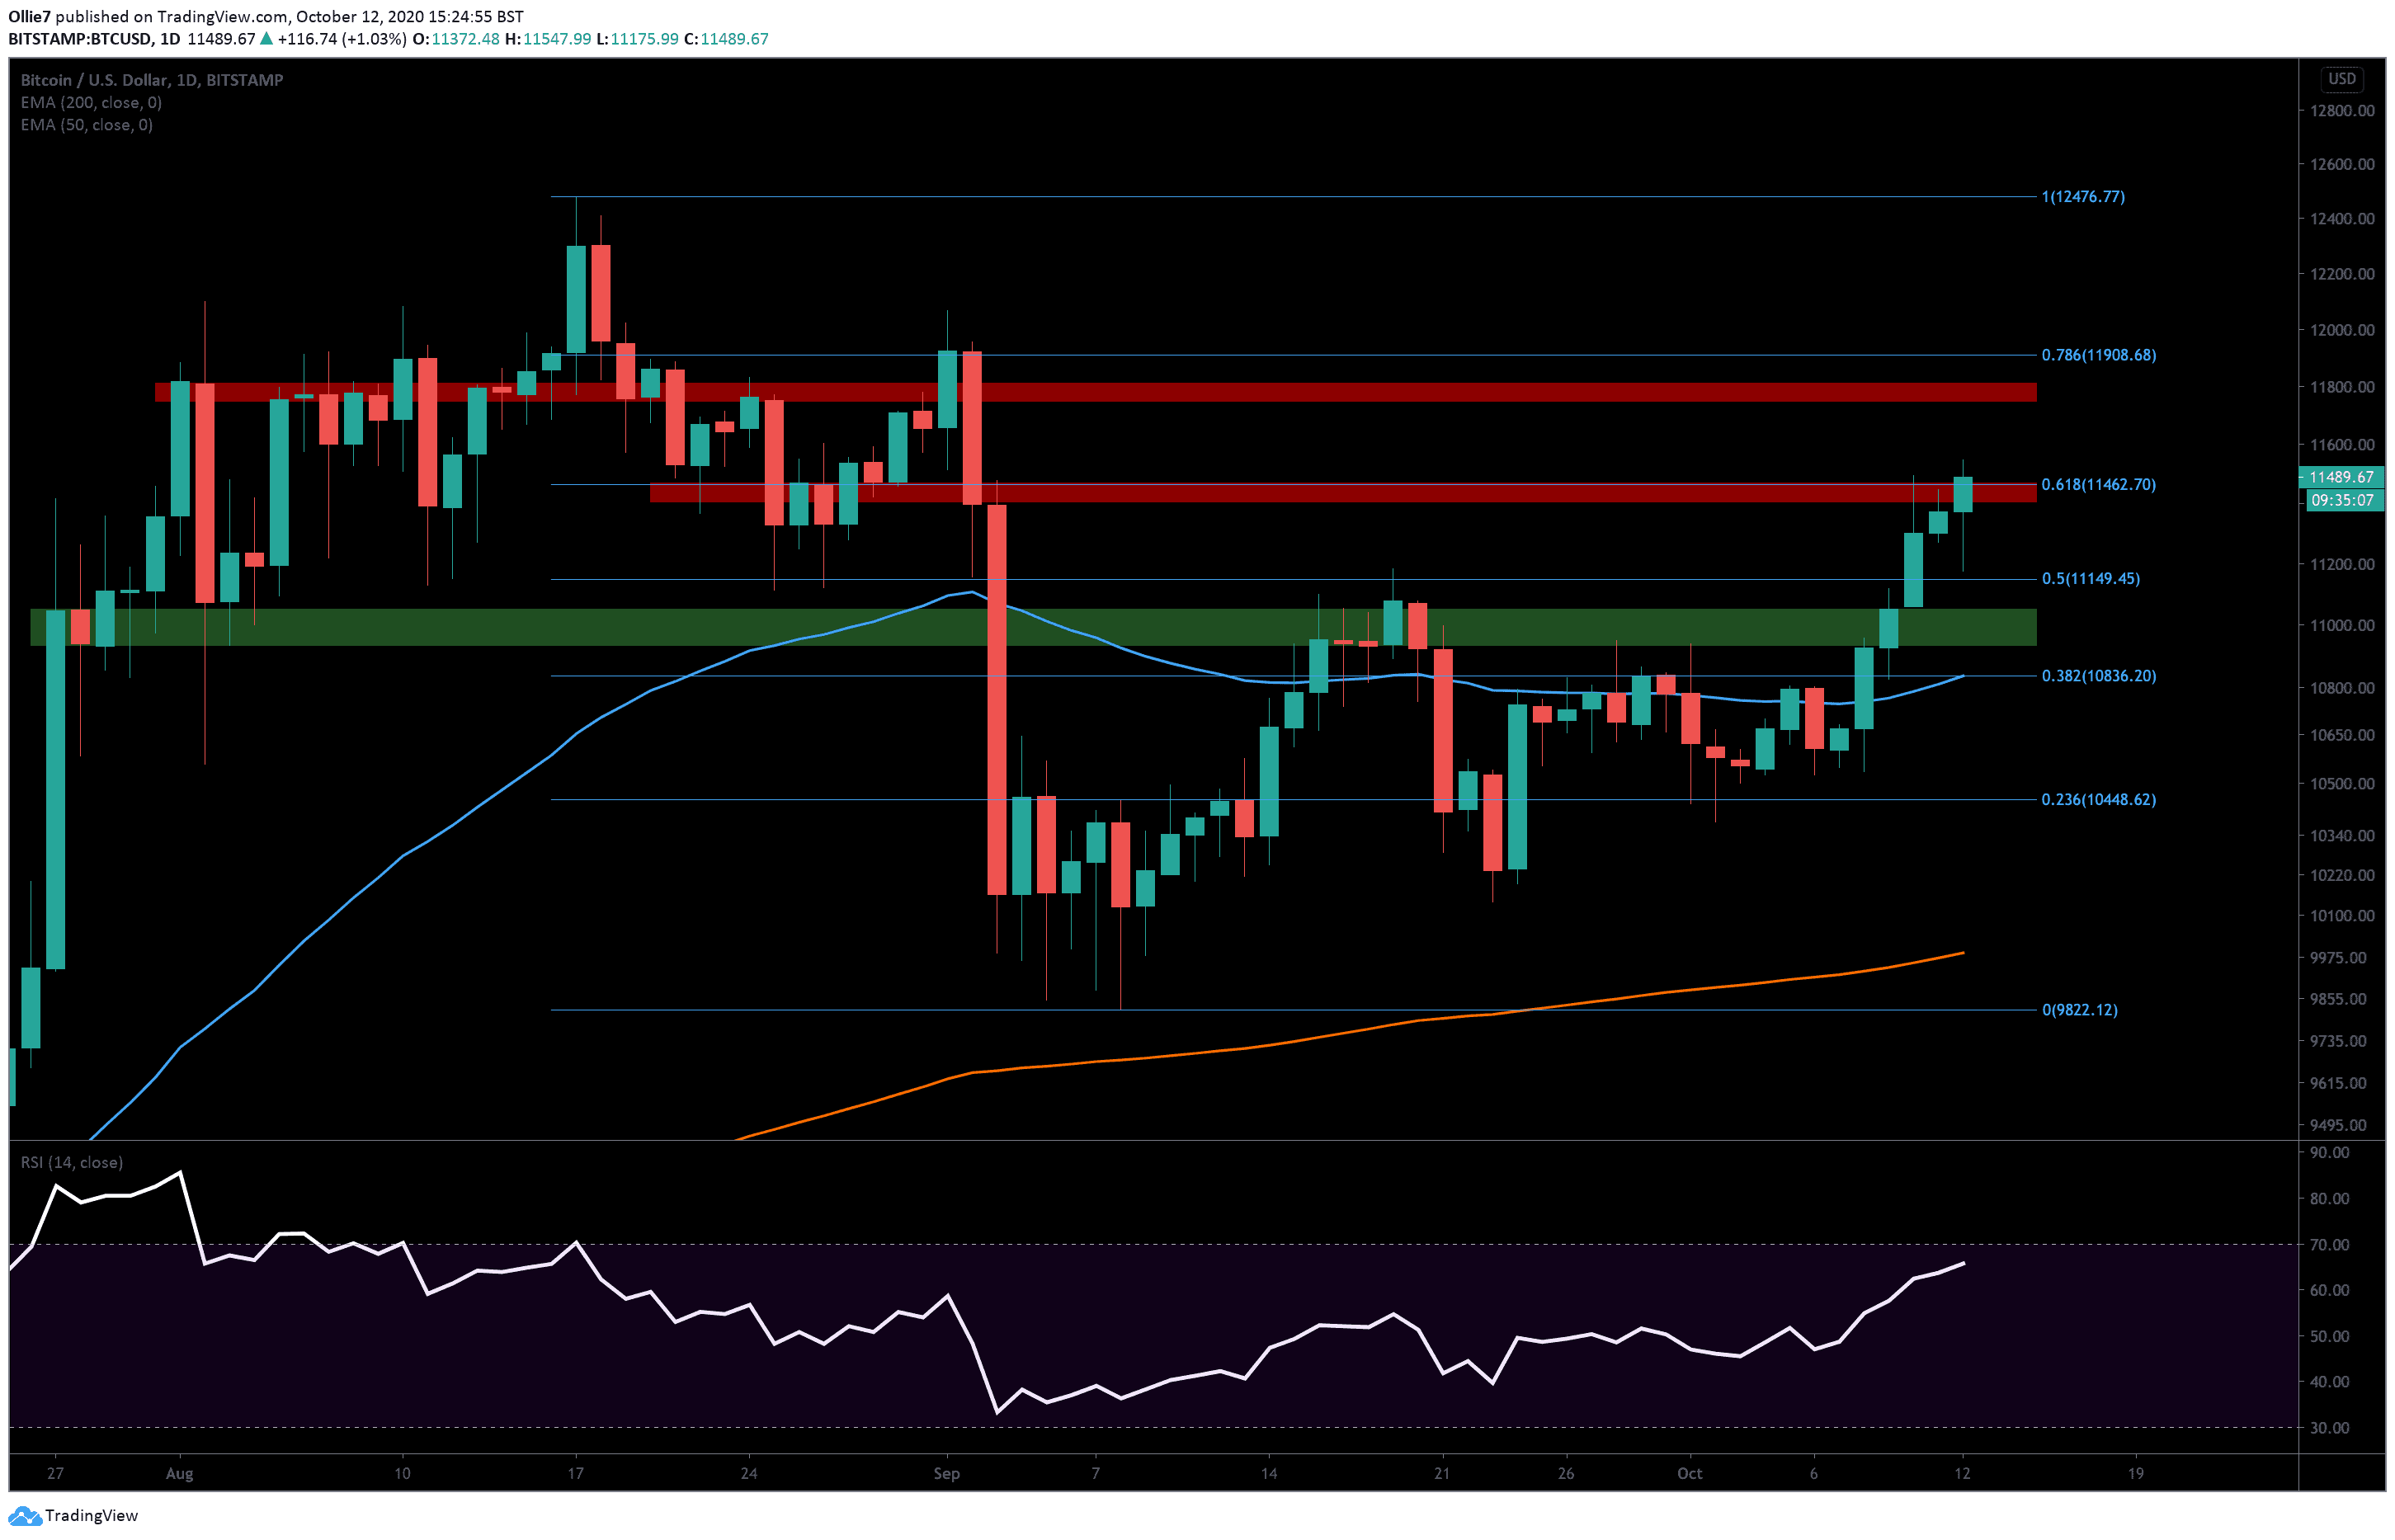
Just hours ago, the leading cryptocurrency had completed a bearish Bart Simpson pattern after crashing down to $11,175 following an extended period of sideways chop. It was looking as though the asset was about to head down to the 0.5 Fibonacci level at $11,150, but new bullish momentum from the American trading session has helped drive BTC back above $11,500. With this, Bitcoin charted a new 5-week high.
$10 billion has returned to the market in the last 2 hours along with $300 million in long interest at the $11,500 mark – according to data by Coinmarketcap and Datamish, respectively.
On the daily BTC/USD chart, we can see that the price is currently fraternizing with the 0.618 Fibonacci level at $11,462 (lower red shaded area). This is a critical area for BTC to hold above and will set a new 40-day daily high if bulls manage to maintain their current momentum into the close.
Looking above, the next areas of resistance will most likely be the $11,600 and the main resistance zone above between $11,750 and $11,810 (upper red shaded area). These price points have been particularly strong S/R levels over the 1-day timeframe.
Above that, we also have the 0.786 Fibonacci level at $11,908, which was the price that Bitcoin started its 16.43% decline during September 2-4. This will undoubtedly be an area of high selling pressure as BTC approaches the psychological, all-important $12,000 level and will need considerable volume to overcome.
Support-wise, there are several possible areas that should help prop up Bitcoin prices if bears take back control of the asset. The $11,245 and 0.5 Fibonacci level at $11,150 will be the first areas to observe if a downtrend begins. From there, we have the first main support zone (green shaded area), which sits around $11,000 to $10,940. This area is also reinforced by the 4-hour 50 EMA line at $11,040.
Underneath that, the 200 EMA is overlapping with the 0.382 Fibonacci level at $10,836 over the 4-hour timeframe, which should also create a solid platform for bullish traders to recover from if Bitcoin attempts to break back into its former range.
Total market capital: $369 billion
Bitcoin market capital: $212 billion
Bitcoin dominance: 57.5%
*Data by Coingecko.