BTC/USD chart via Tradingview
Bitcoin’s price has left everyone in shock today. Not only has the leading crypto broken the psychological $20,000 mark in the last 24 hours, but also the $21K, $22K, and $23K levels in rapid succession too.
Over $71 billion has entered the global crypto market during this historical movement, pushing the weekly increase in worldwide crypto investment up to $119 billion.
The dramatic surge in price has wiped out over 474 short positions on BitMEX worth a combined $131.4 million. This will have likely caused a majority of liquidated traders to buy back into BTC to recuperate losses, which in turn will have added to the already extremely high buying pressure.
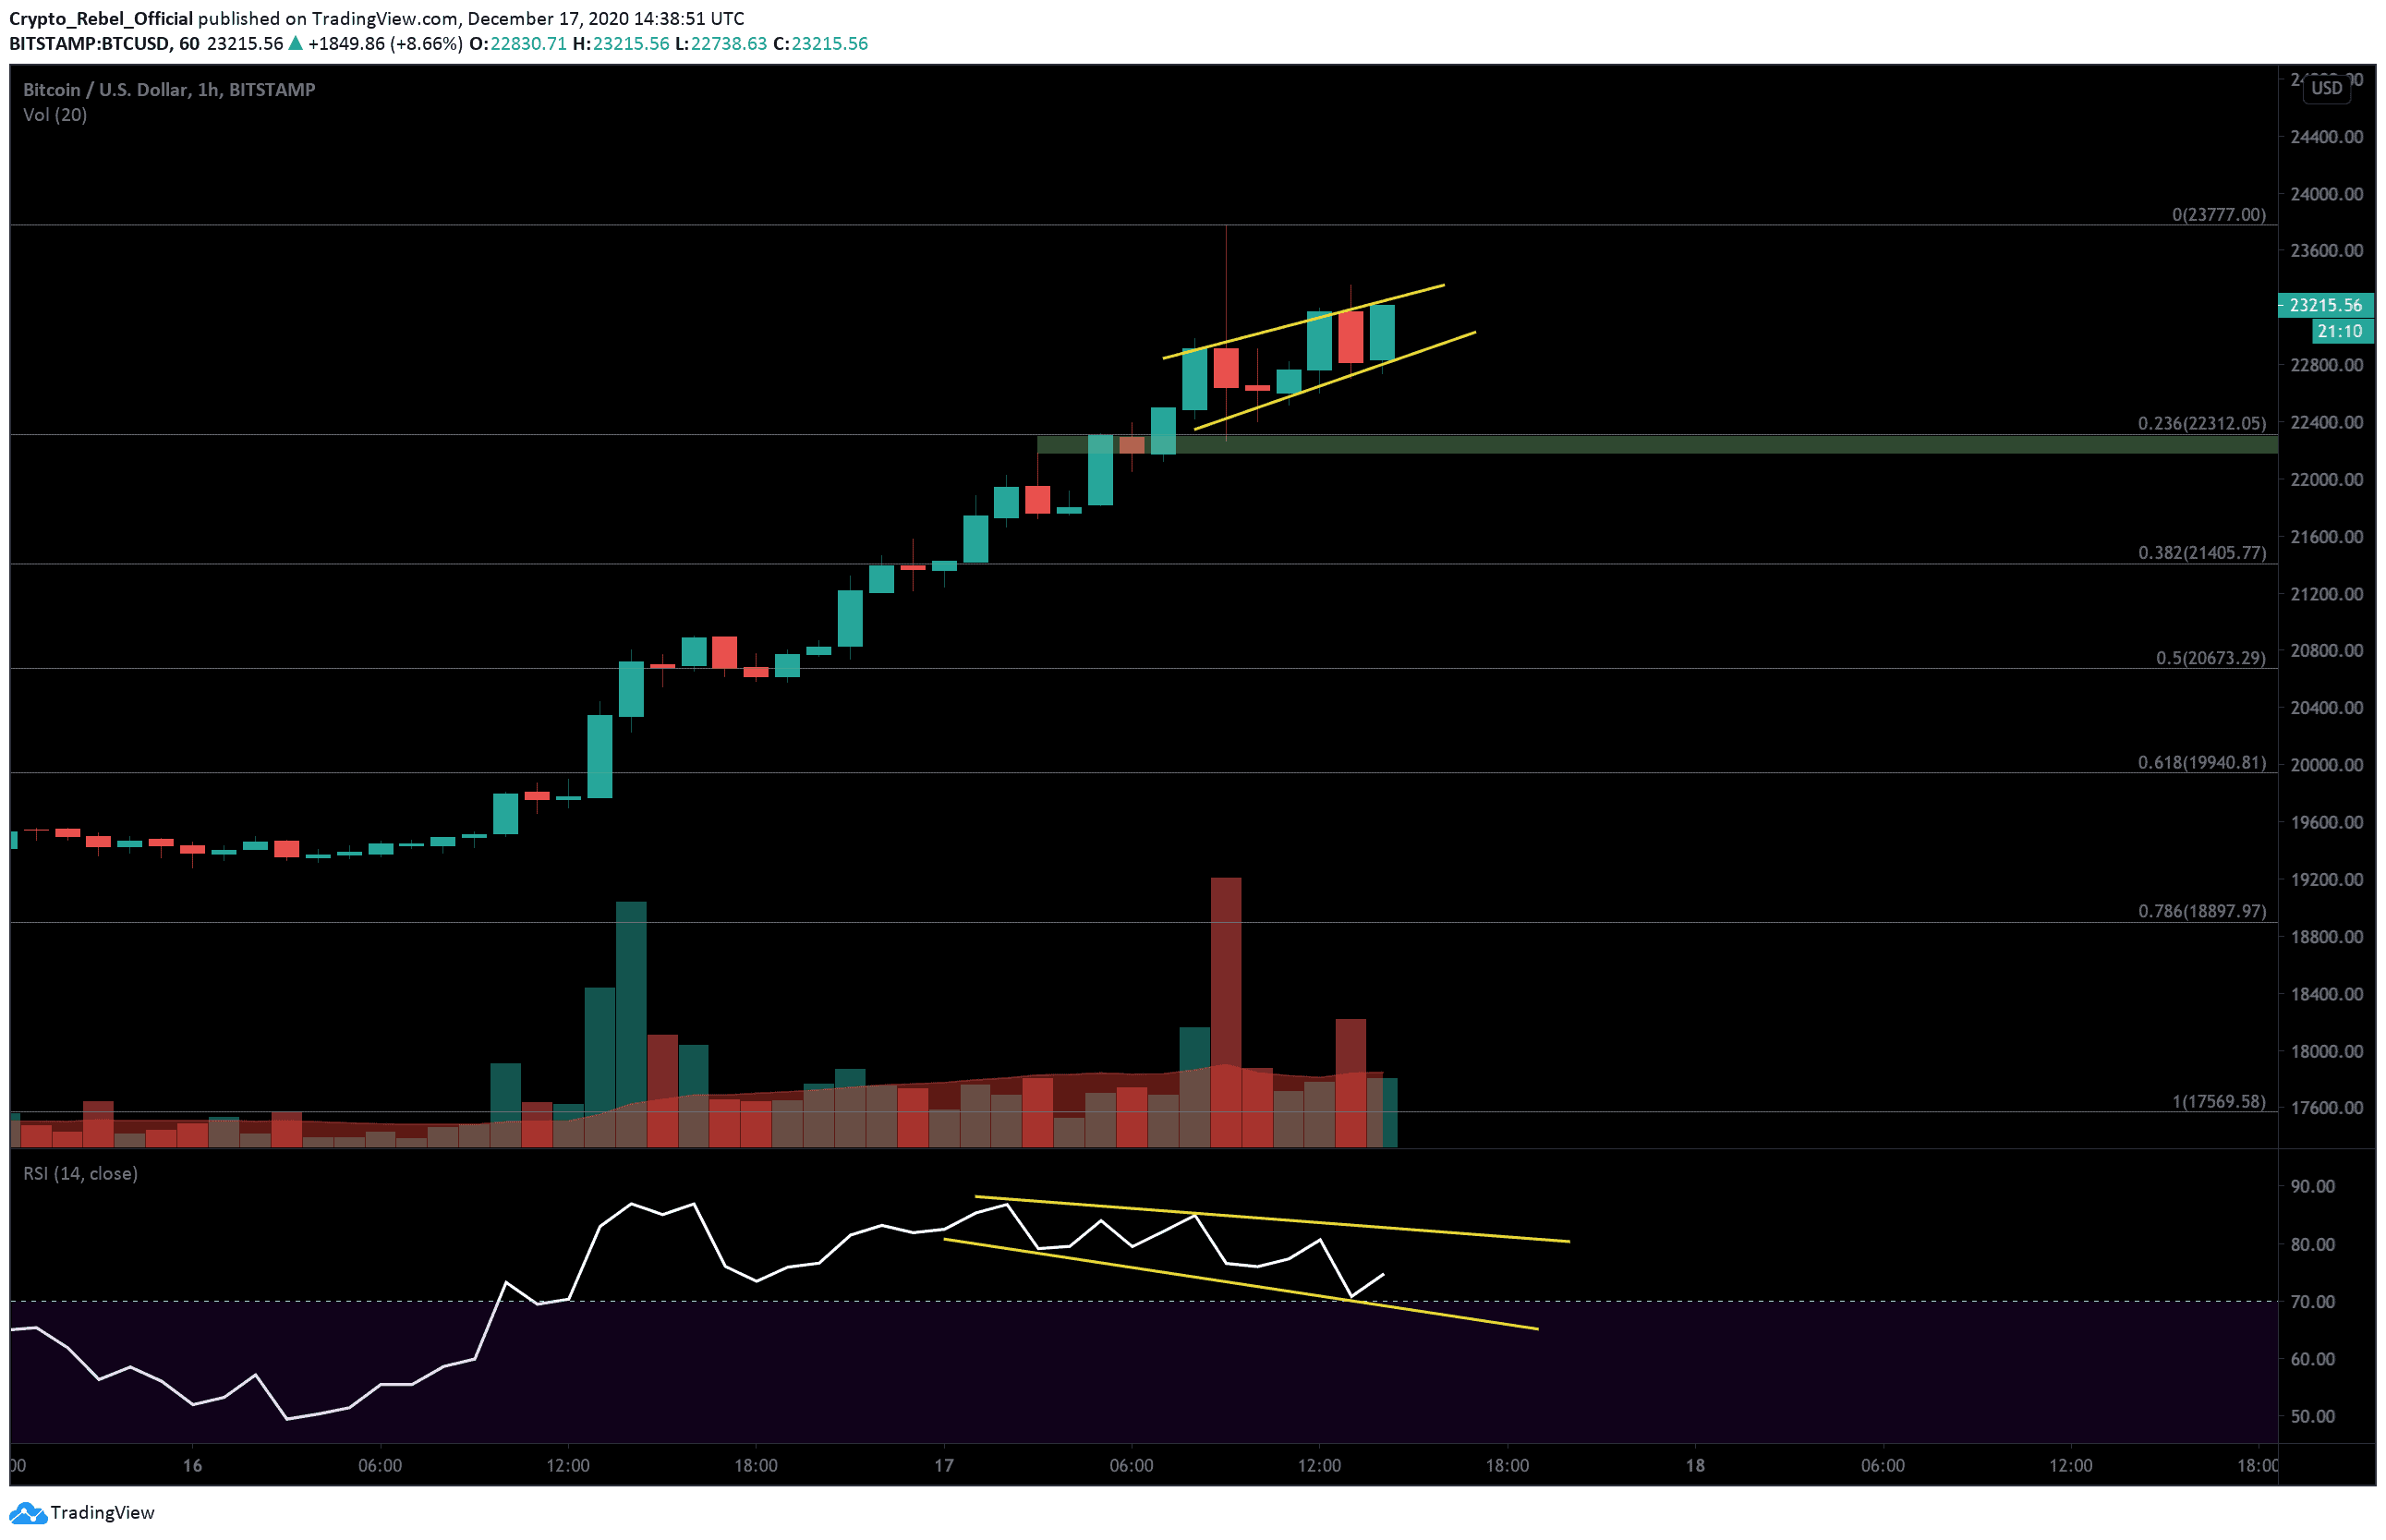
On the hourly BTC/USD chart, we can see that the RSI indicator and price action are beginning to bearishly diverge (yellow lines) which suggests momentum is beginning to wane in the current uptrend. It doesn’t necessarily mean that a crash is coming, but it does suggest that bullish traders will need to recharge before attempting a new uptrend.
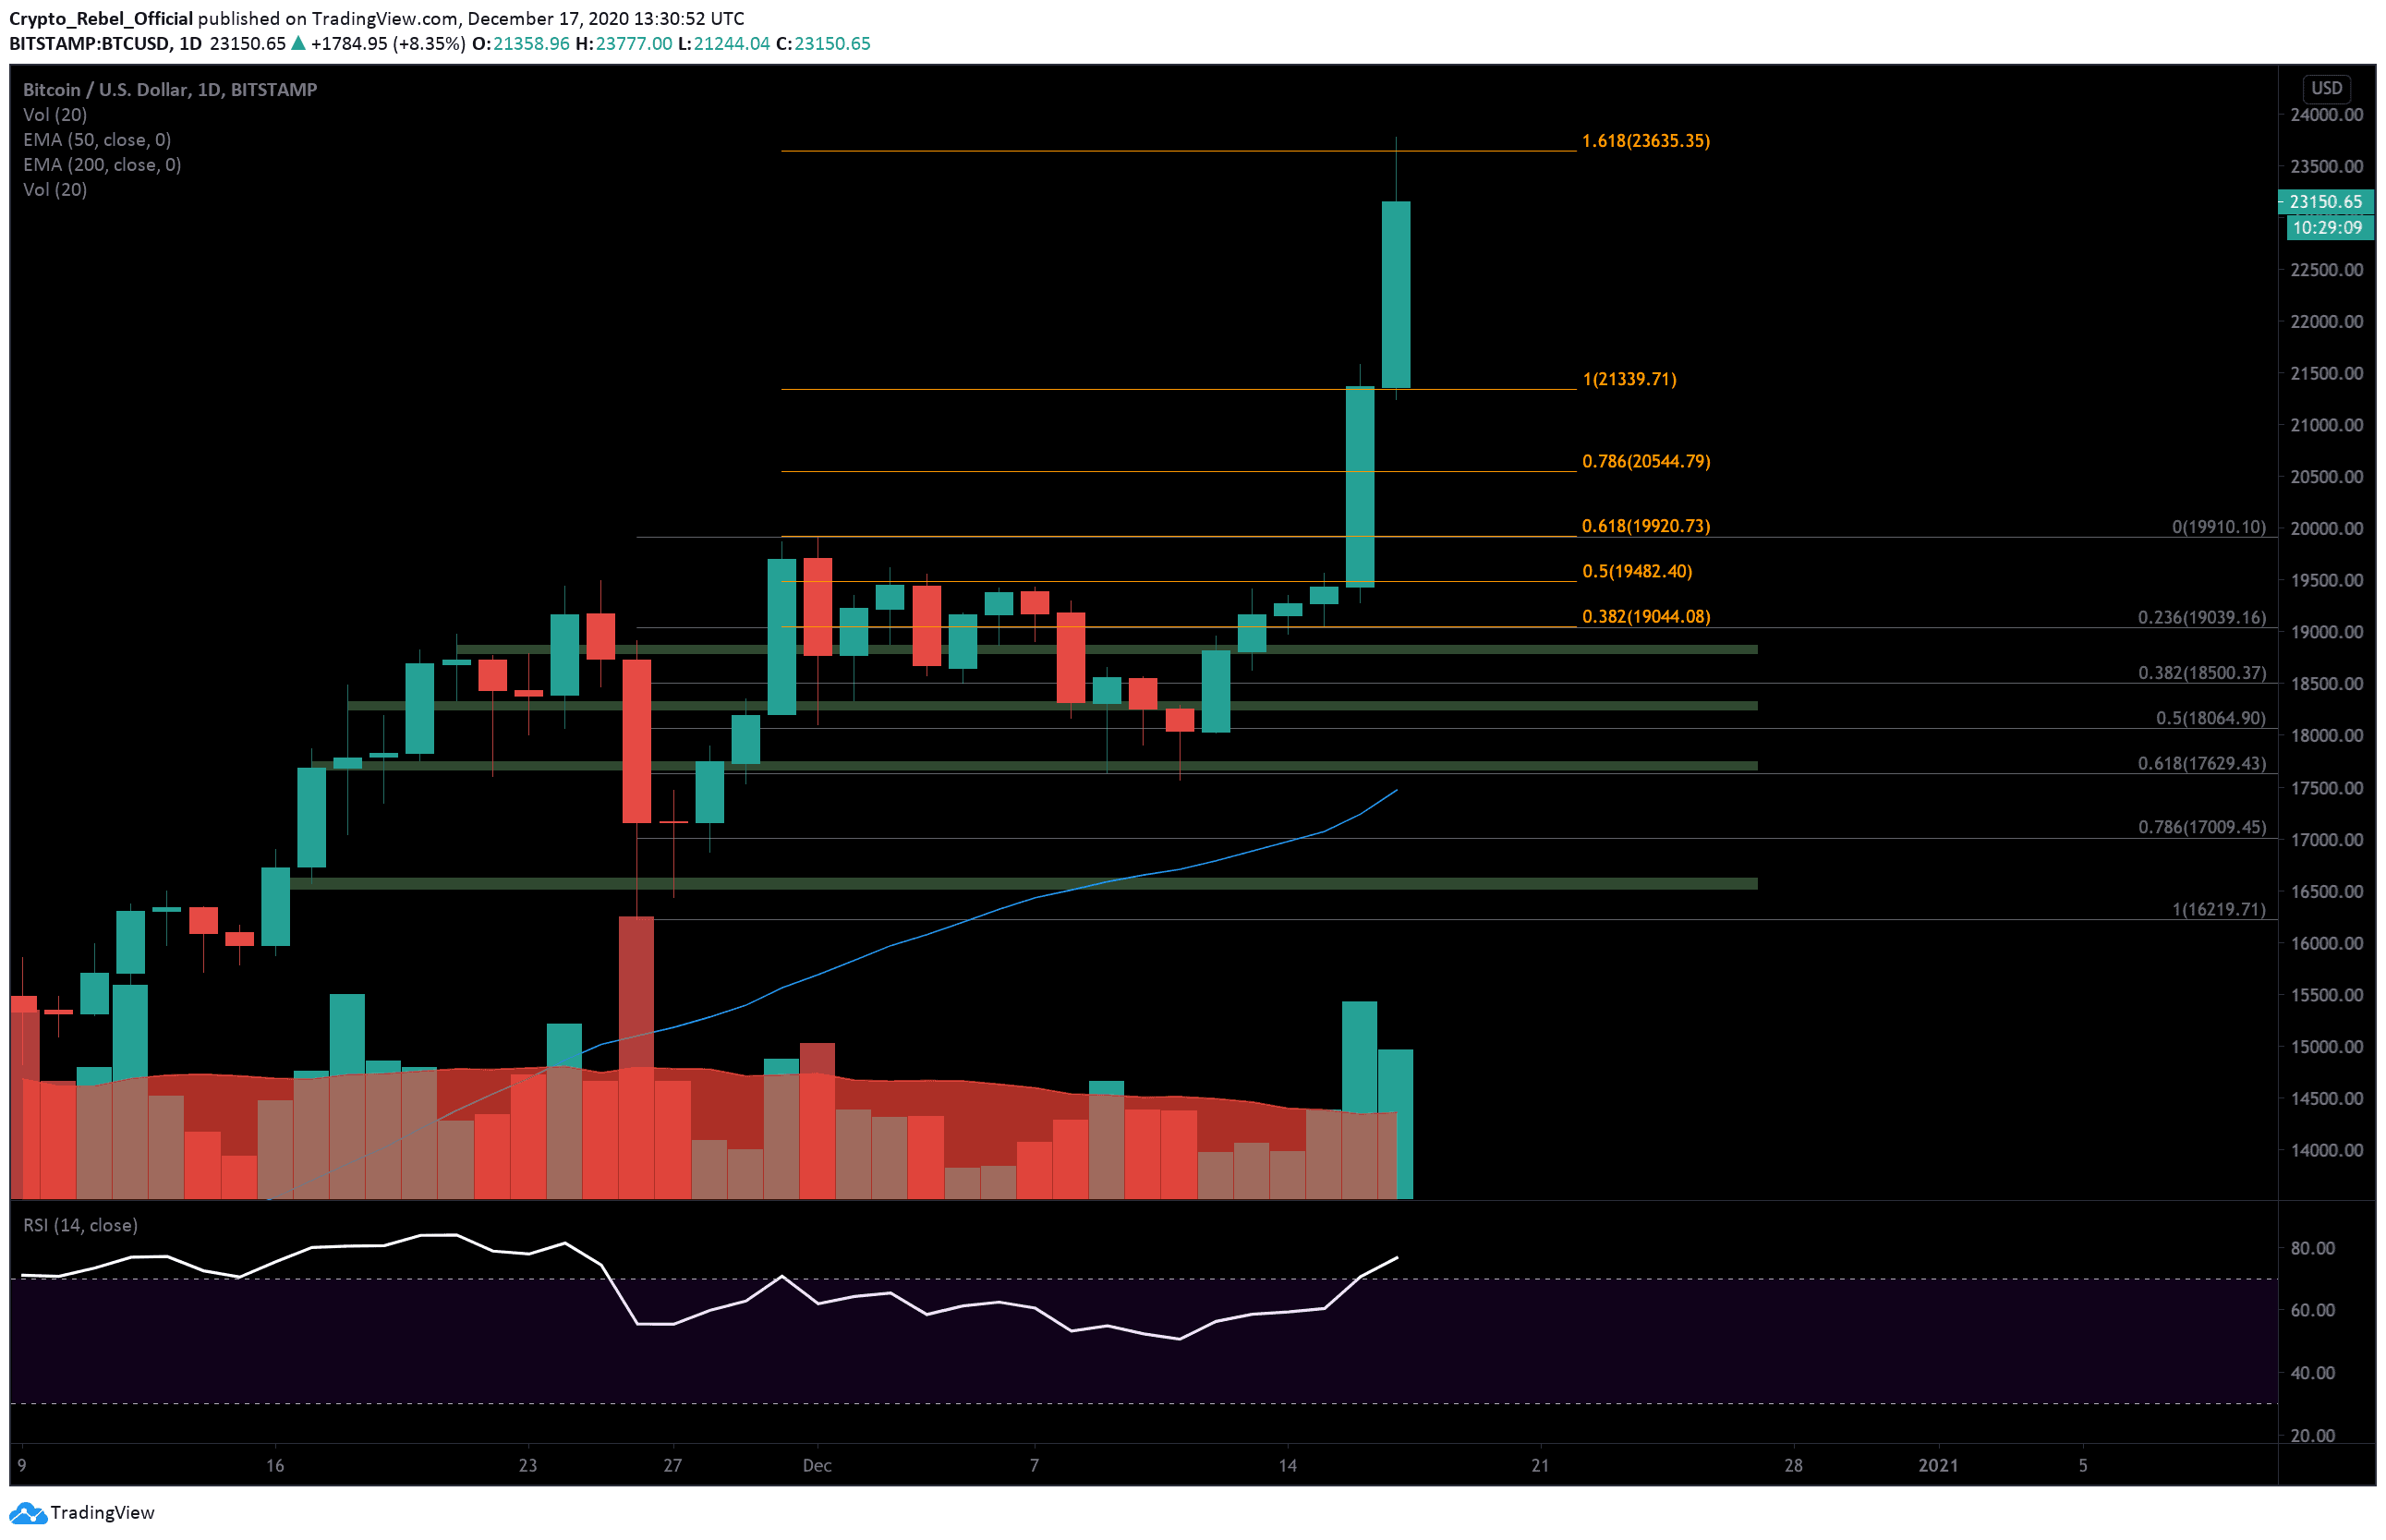
On the 1-Day BTC/USD chart, we can see that trading activity on December 16th closed pretty much perfectly at the 1.0 Fibonacci extension level at $21,339.
However, to see where the asset will likely go in the short-term we need to look at the Fibonacci retracement levels on the hourly timeframe to get a better idea.
From the lowest low of the current trend at $17,570 to the current all-time high, we can see that the 0.382 and 0.5 Fib levels ($21,405 and $20,673, respectively) stand out as strong possible support areas if Bitcoin begins to reverse. There is also an order block support zone (green bar) just under the 0.236 Fibonacci Level around $22,250 which may act as a key intraday level during the rest of today’s trading session.
Looking above, we will continue to look at major psychological levels as the next likely areas of resistance; $23,000, $24,000, $25,000, and so on.
Chances of a strong correction are likely, given that there is so much hype behind the asset right now. Once that greed turns to fear we’re almost certain to see Bitcoin prices tank as traders try to secure their new gains in more stable pegged-value assets.