

Bitcoin is up by an impressive 13% from yesterday’s low at $34,760. The primary cryptocurrency rebounded from this support after dropping from $37,400 on Saturday. Over the past days, bitcoin was unable to break above the $36K mark, until one tweet.
Elon Musk, once again, caused the bitcoin price to fluctuate following another tweet about that Tesla could resume accepting Bitcoin.
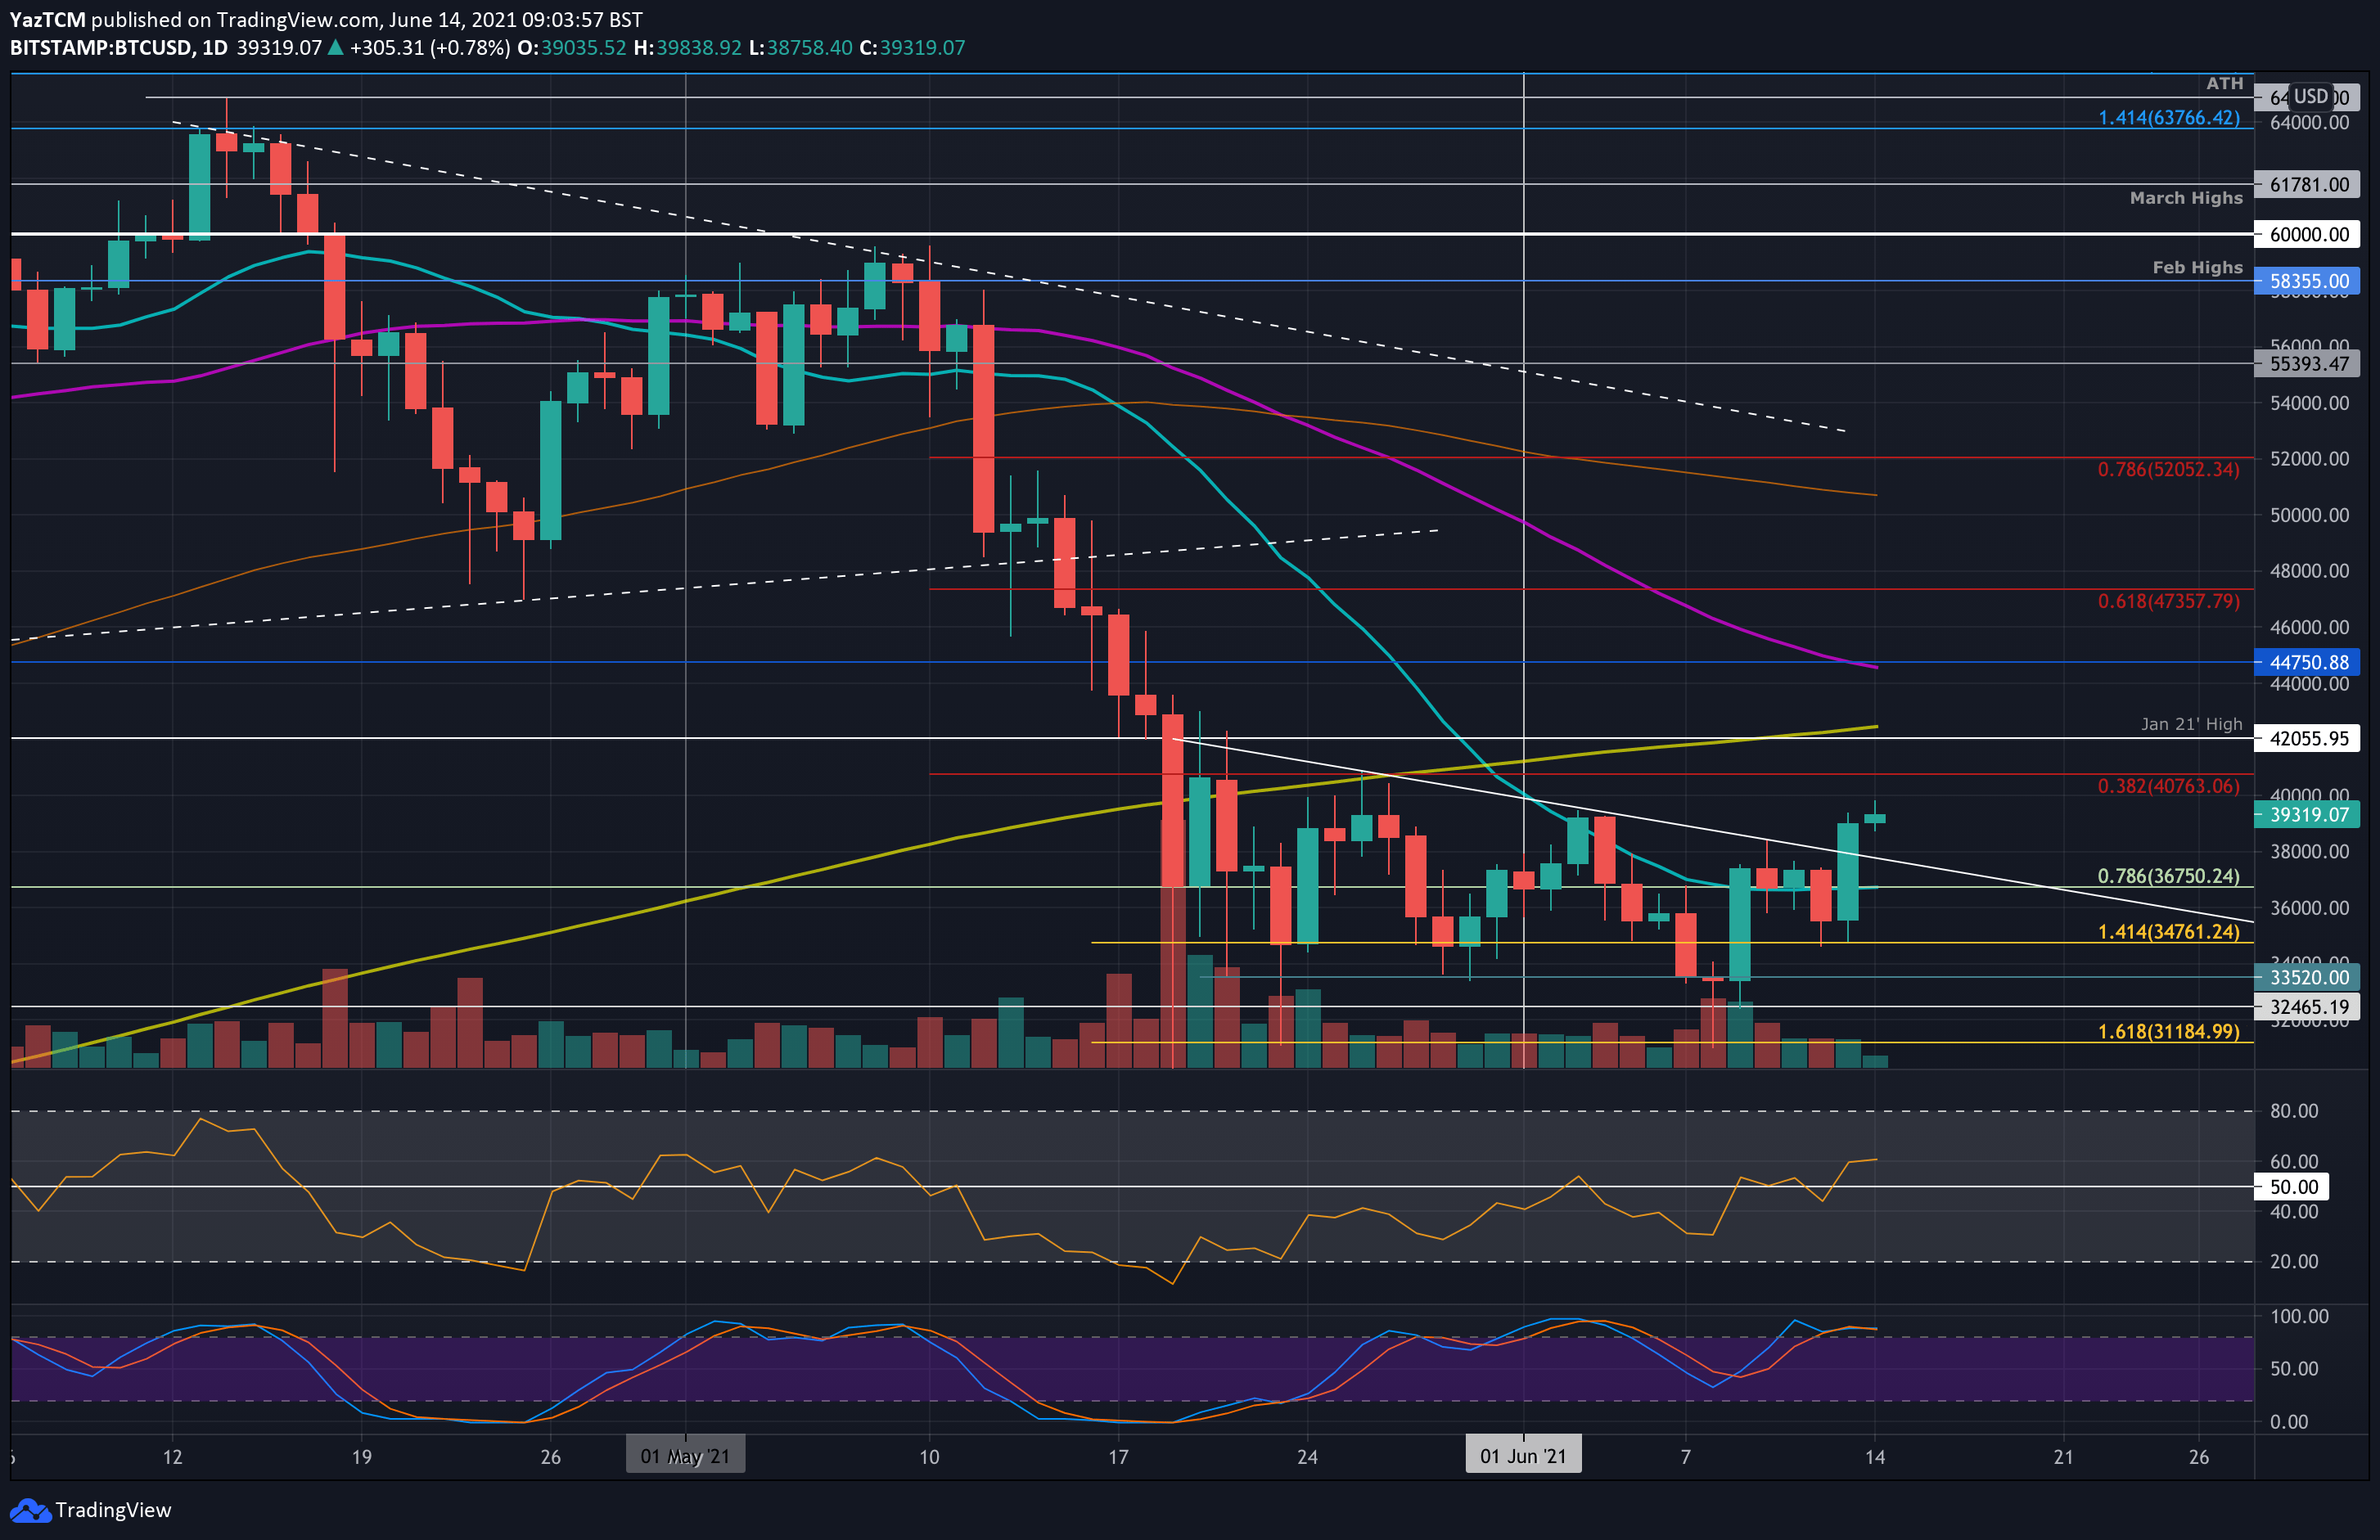
Following the breakout, bitcoin was able to breach resistance at a descending trend line at $38,000 that suppressed the market since the mid-May market capitulation. Previously, BTC attempted to break this trendline three times and failed to do so.
Yesterday’s candle closed above the line, confirming the breakout. Today, BTC pushed to $39,840, creating a fresh high for the month of June 2021. Interestingly, this breakout came just three days after the Morning Star reversal pattern we highlighted in a previous analysis. However, it is essential to keep in mind that there is still critical resistance ahead up to $42,500, where lies the 200-day moving average line.
Today’s price increase allowed BTC to create the first higher high since the market selloff. What is now essential for the bulls, is for BTC to make a higher low above $39,200 to break the bearish trajectory of lower highs (the last of them took place at the beginning of June).
Nevertheless, all eyes are now looking between $42,000 and $42,500 as the next pivotal level for a BTC recovery.
BTC Price Support and Resistance Levels to Watch
Key Support Levels: $39,200, $38,000, $36,750, $36,000, $34,760.
Key Resistance Levels: $40,000, $40,760, $42,000 – $42,500, $44,700, $46,000.
Looking ahead, the first resistance lies at $40,000. This is followed by $40,760 (bearish .382 Fib), $42,000 (Jan 2021 highs), $42,500 (200-day MA), and $44,700 (50-day MA). Added resisatnce lies at $46,000 and $47,360 (bearish .618 Fib).
On the other side, the first support lies $39,200 (previous local high). This is followed by $38,000, $36,750, $36,000, and $34,760.
The RSI is now cleanly above the midline for the first time since May 10th – before the market capitulation. This indicates that the bulls are in the middle of regaining the market momentum. However, the 4-hour cahrt’s RSI shows that the market might be overbought and might lead to a short-term retracement.
Bitstamp BTC/USD Daily Chart
Bitstamp BTC/USD 4-Hour Chart

Disclaimer: Information found on CryptoPotato is those of writers quoted. It does not represent the opinions of CryptoPotato on whether to buy, sell, or hold any investments. You are advised to conduct your own research before making any investment decisions. Use provided information at your own risk. See Disclaimer for more information.
Cryptocurrency charts by TradingView.


