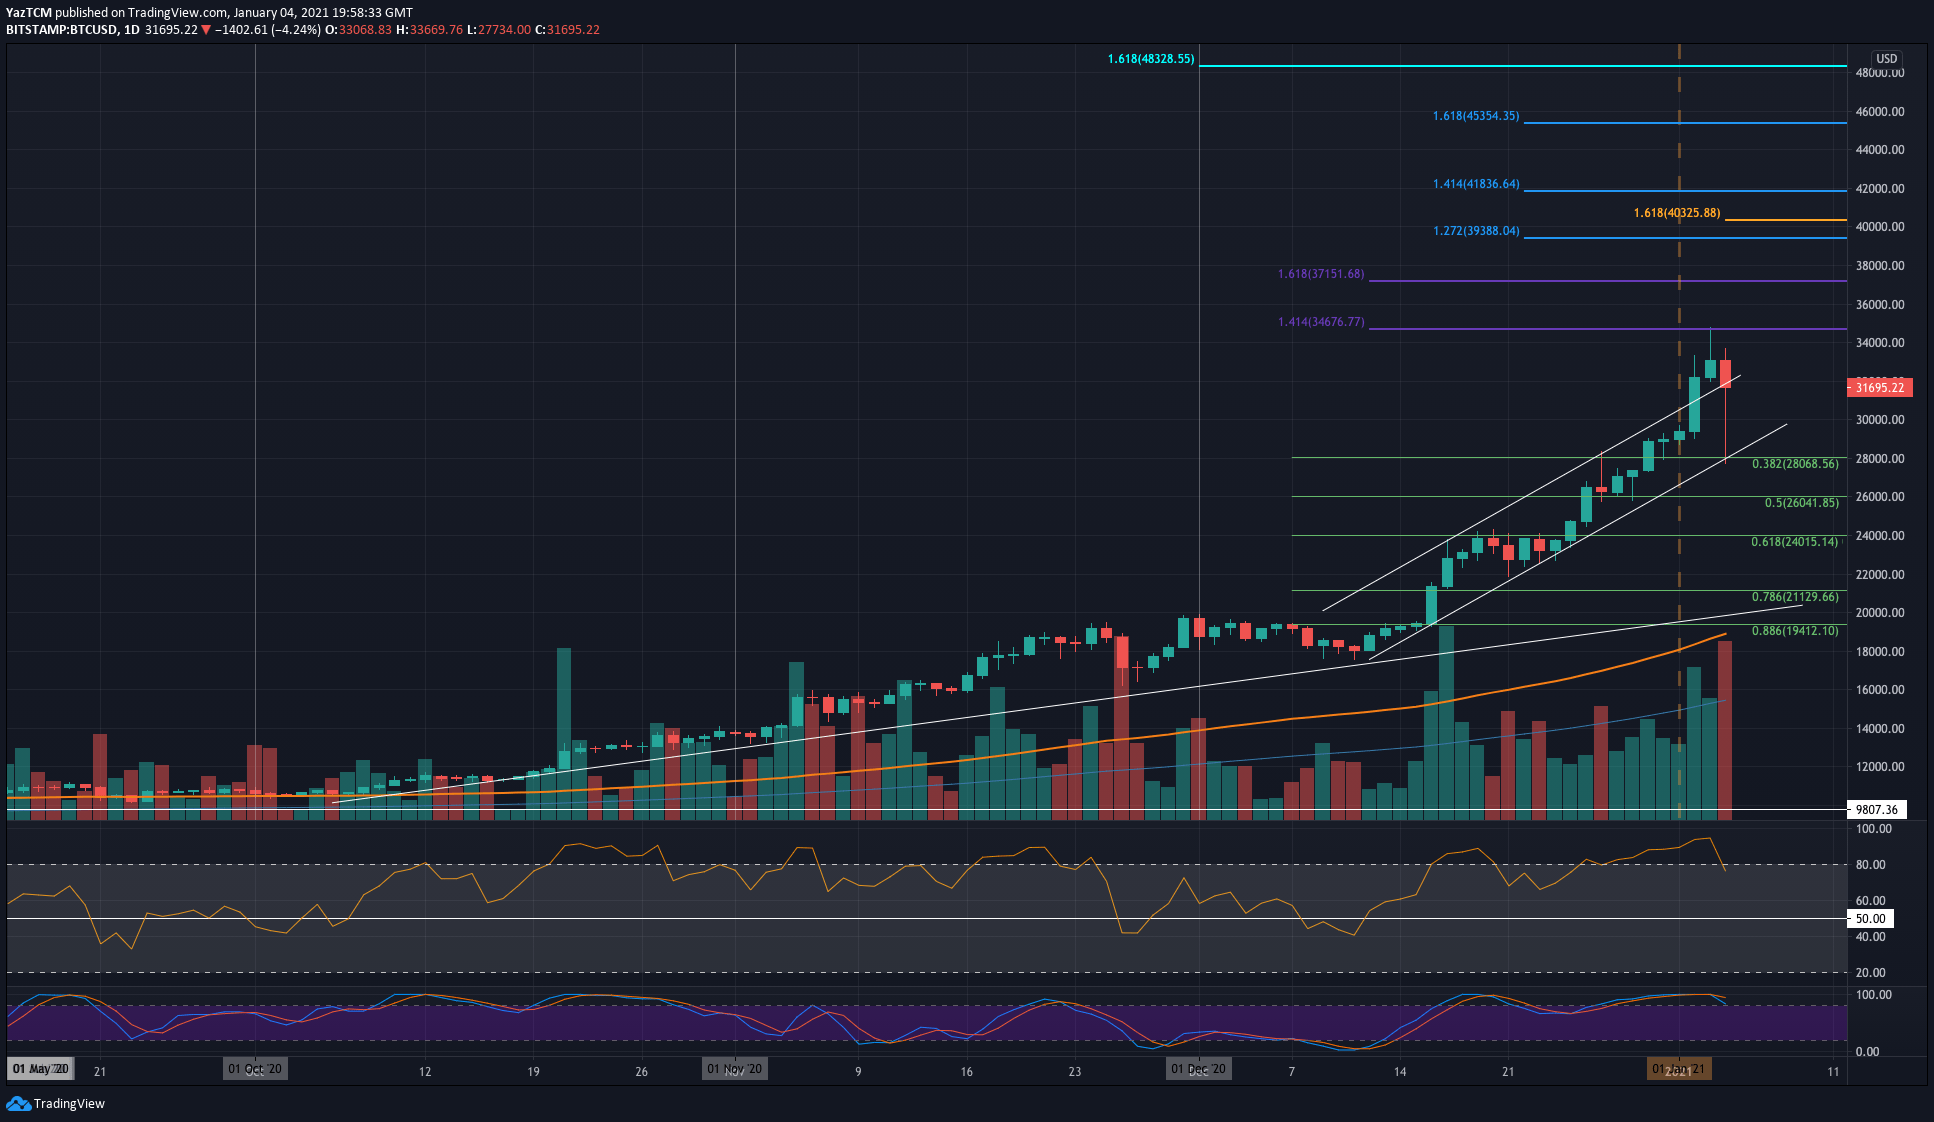
BTC/USD Daily Chart. Source: TradingView
Bitcoin price saw a day of major volatility after topping out at $34,800 yesterday. From there, the primary cryptocurrency started the week by dropping a sharp 16% to reach as low as $27,800 on Bitstamp in a much-needed retracement following an enormous rally.
As shown on the daily chart below, Bitcoin reached the lower line of the ascending channel.
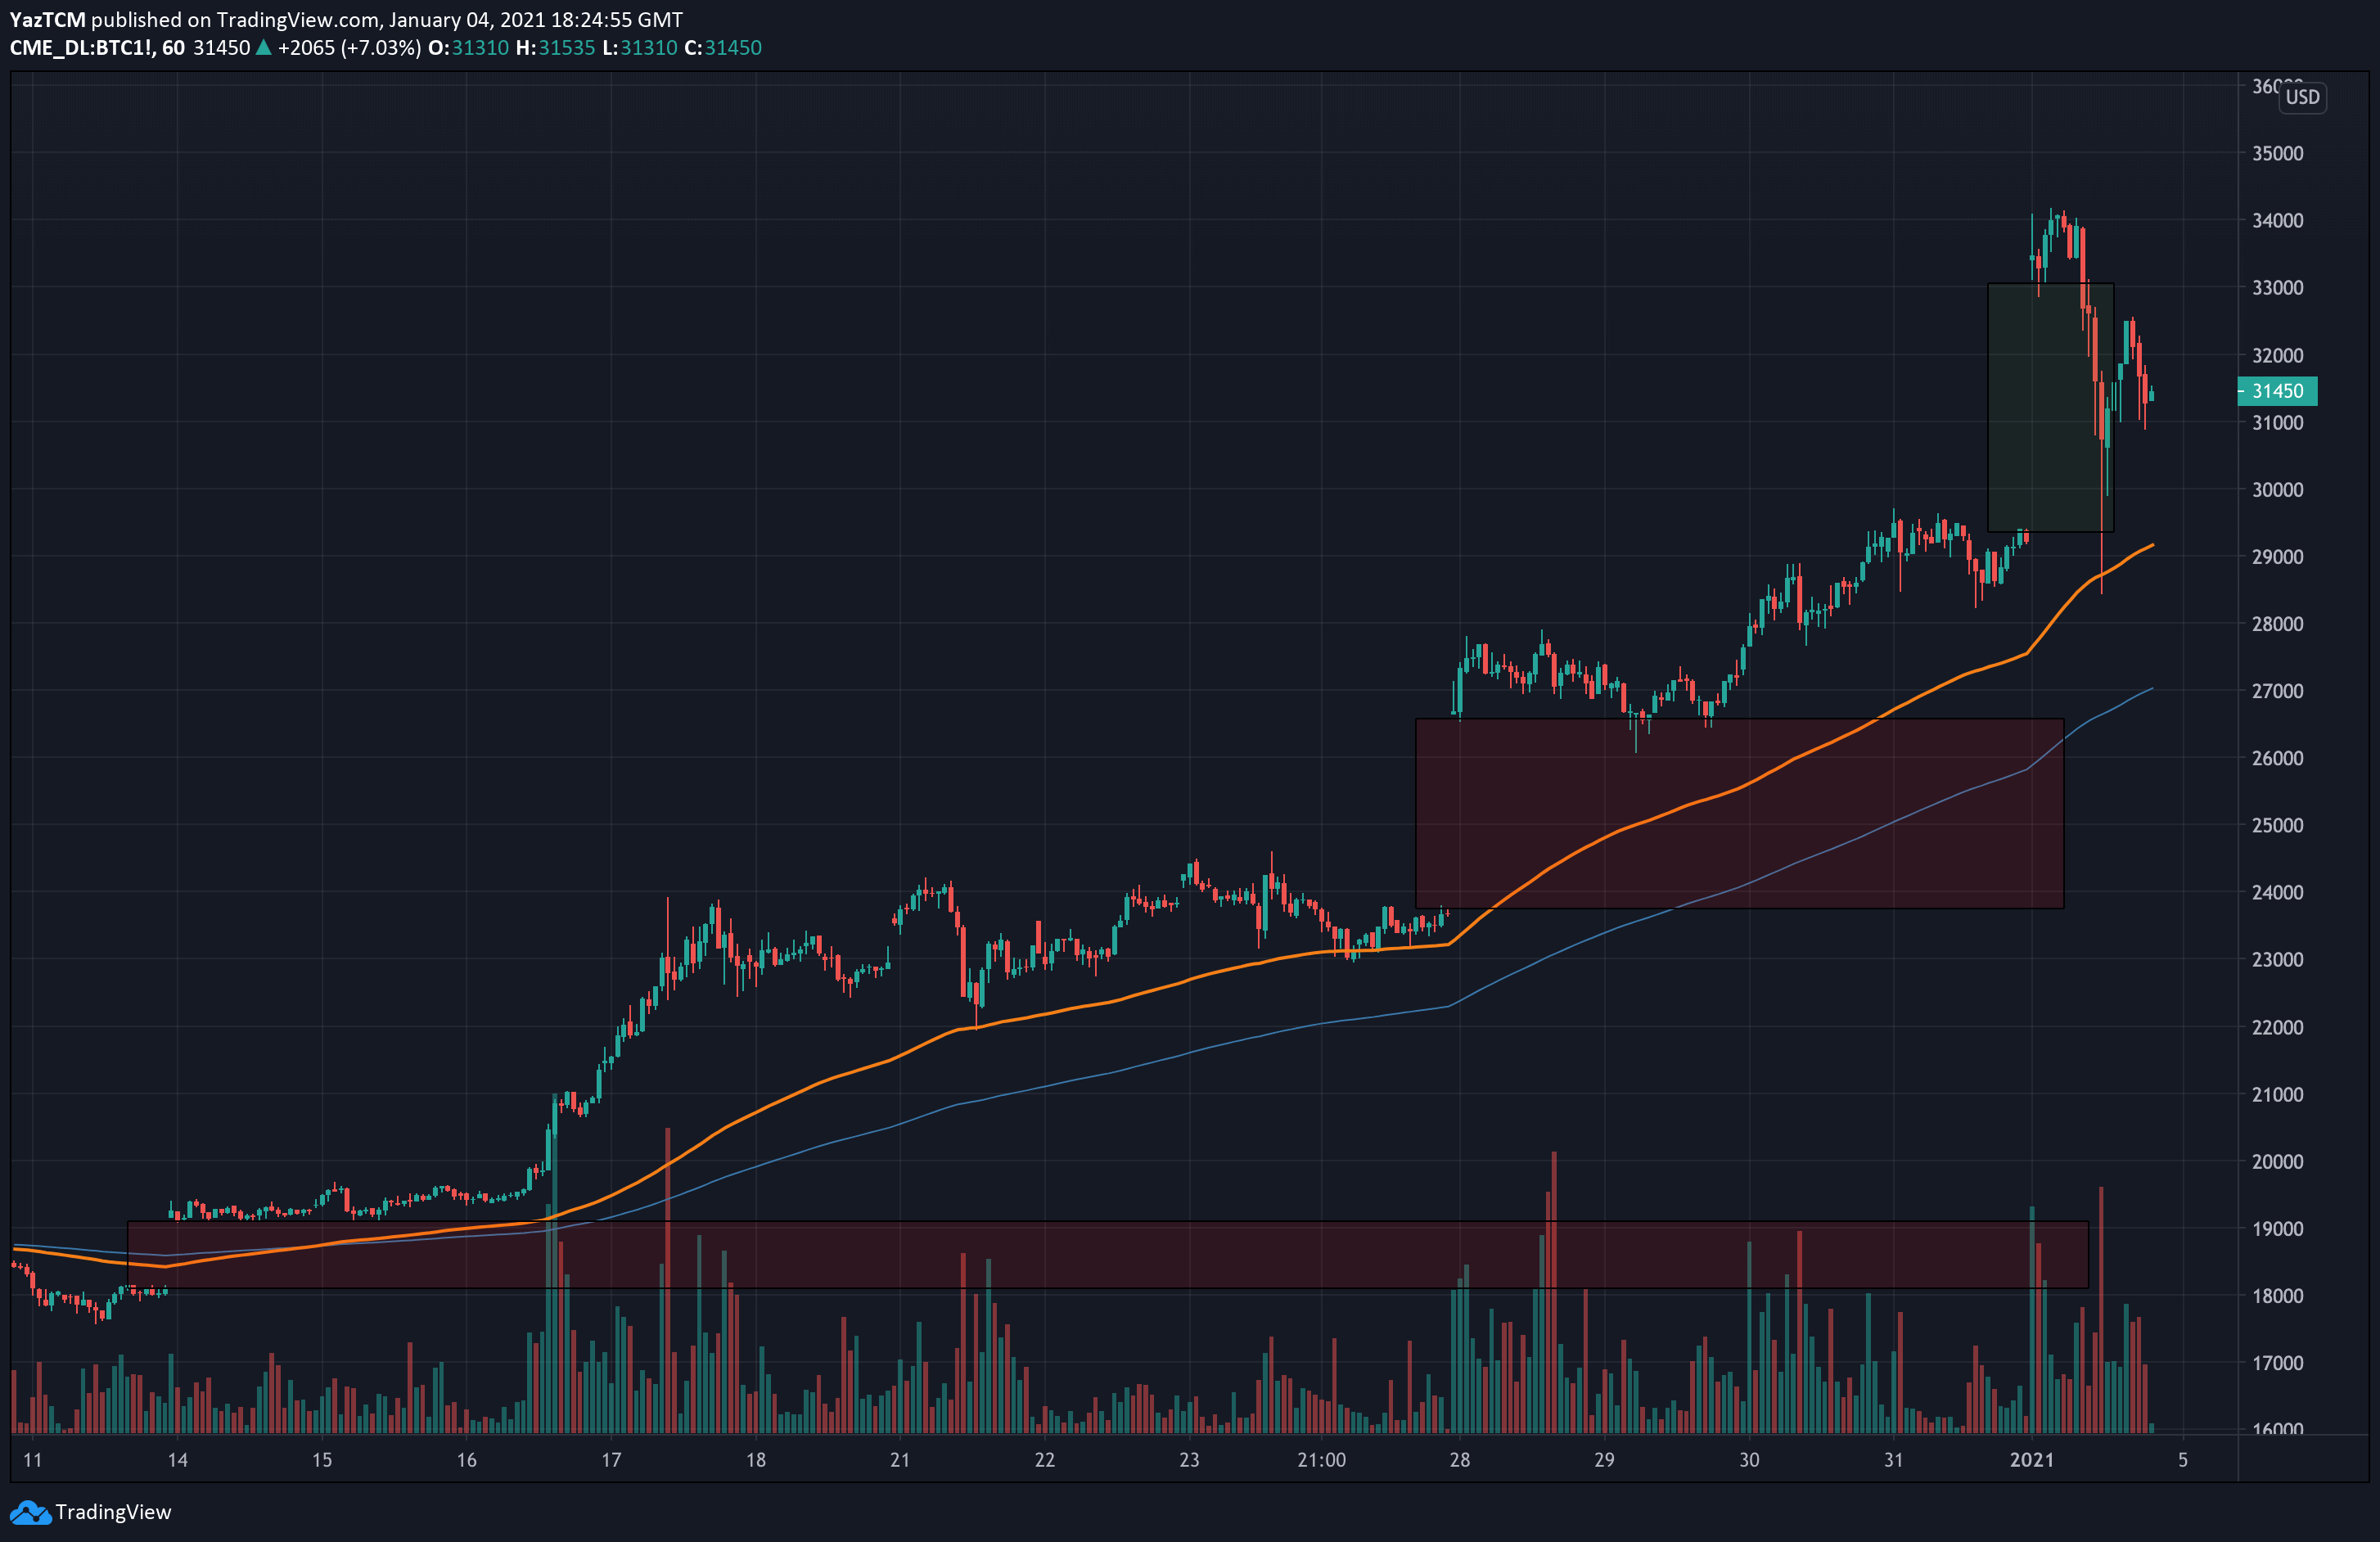
In our yesterday’s analysis, we mentioned some bearish divergence on the 4-hour timeframe, which seems to have played out today. This retracement filled the CME Futures gap that was left open at $29K. Gaps tend to get filled; however, despite this current gap, there are two more gaps in the range: $24K and $18K, as can be seen on the CME chart below:
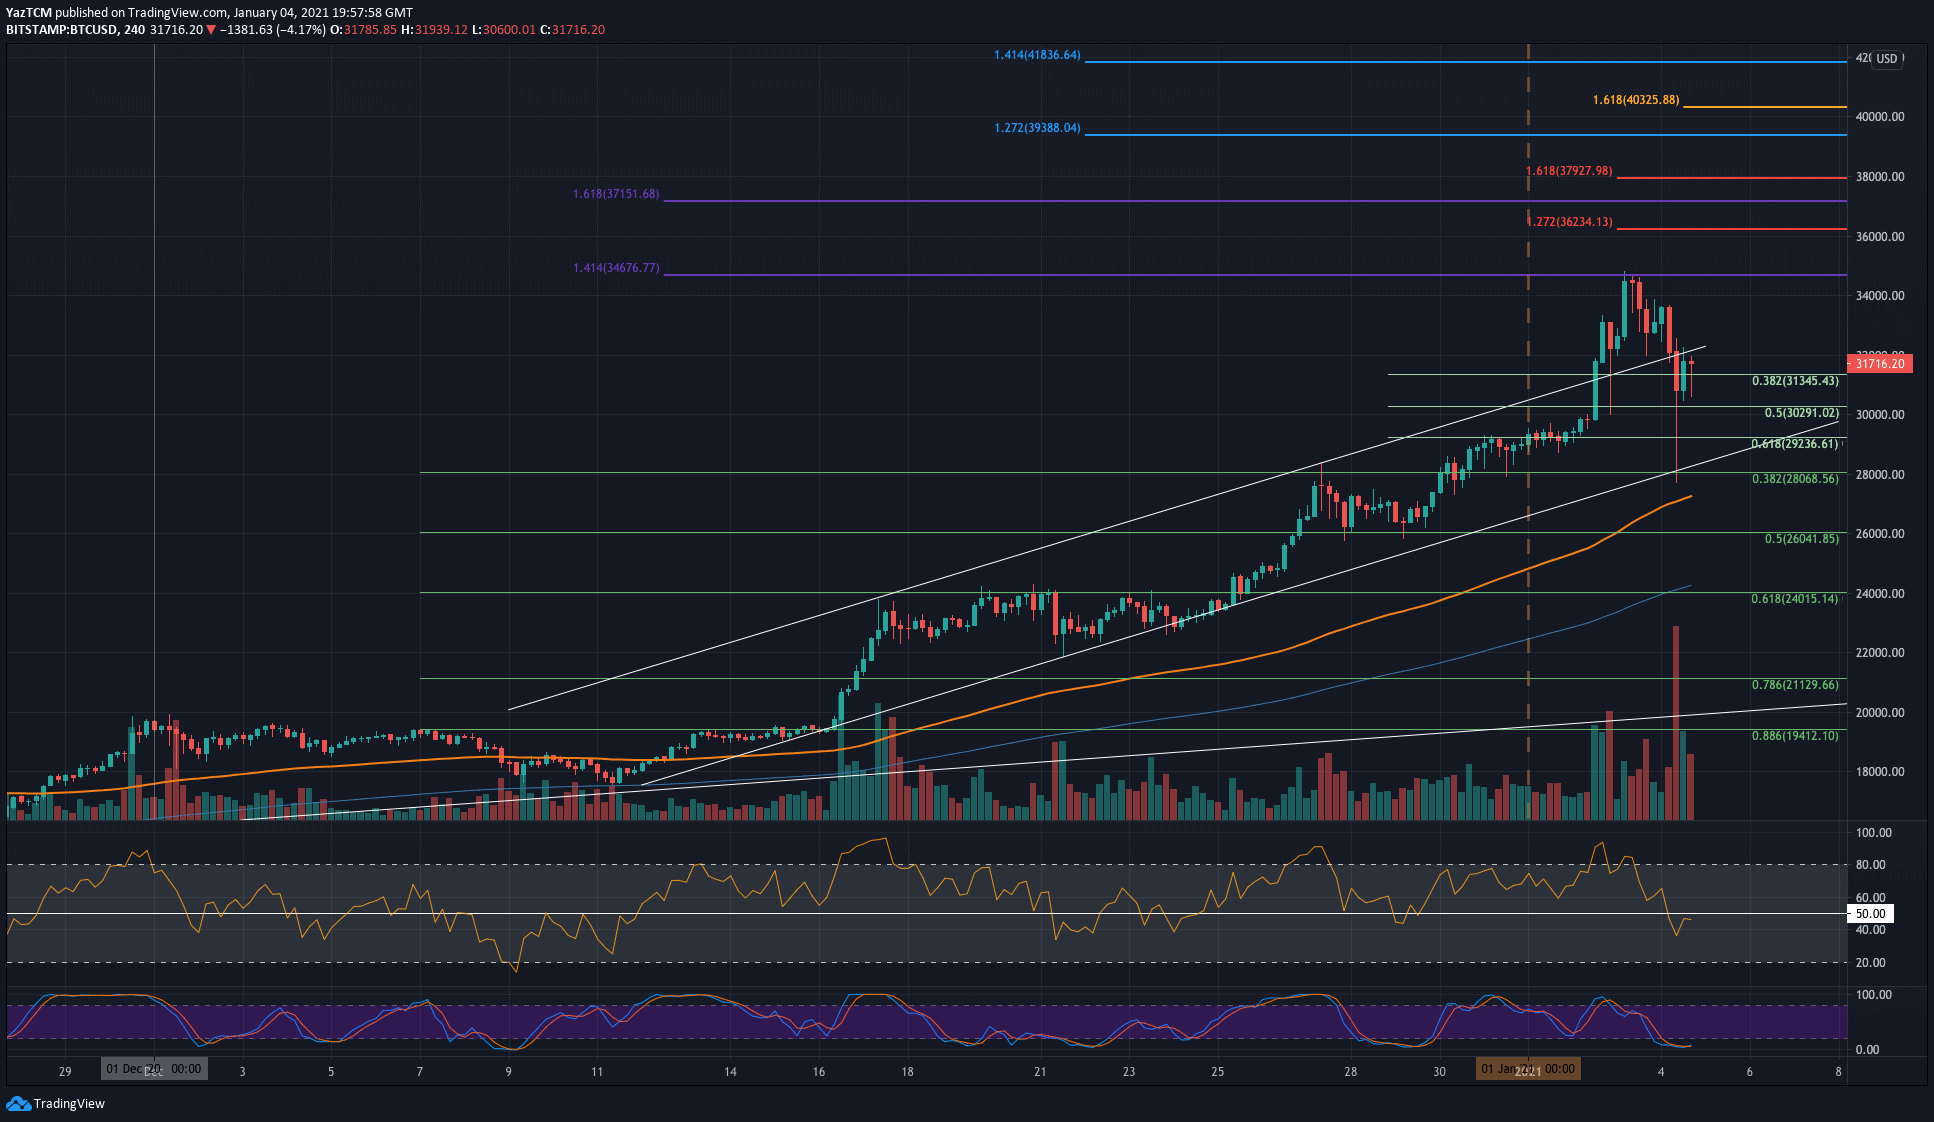
Nevertheless, following the huge drop, Bitcoin price has recovered, reaching a local high at $32,200. Since reaching the local high, Bitcoin continued downwards and trading mostly around $31K as of writing these lines.
Key Support Levels: $31,245, $30,300, $30,000, $29,300, $28,000.
Key Resistance Levels: $32,200, $33,100, $34,680 – $34,800, $36,000, $36,235.
Looking ahead, the first major level of resistance is located at $32,200 (today’s high following the drop). This is followed by $33,100 – the closing price from yesterday.
Further above lies $34,680 (1.414 Fib Extension) and the current ATH at $34,800. $36,000, and $36,235 (short term 1.272 Fib Extension) are next.
On the other side, the first level of support lies at $31,345 (short term .382 Fib). This is followed by $30,300 (short term .5 Fib), $30,000, and $29,300 (short term .618 Fib). Further below lies today’s low at $27,800 – $28,000.
The daily RSI has tumbled from overbought conditions as the bullish momentum starts to fade away slowly. In the shorter term, the 4-hour, the RSI has slipped into bearish territory.