Bitcoin, just like Bitcoin, is sometimes having wild moves that are unexpected. As we mentioned in our recent price analysis, the last week was very volatile and abnormal for BTC.
After breaking the bullish uptrend, followed by 38.2% corrections, we started to witness the abnormal behavior: Bitcoin dropped down almost to $9400 before a pump to $10,300, which had quickly turned into a classic Bull-trap.
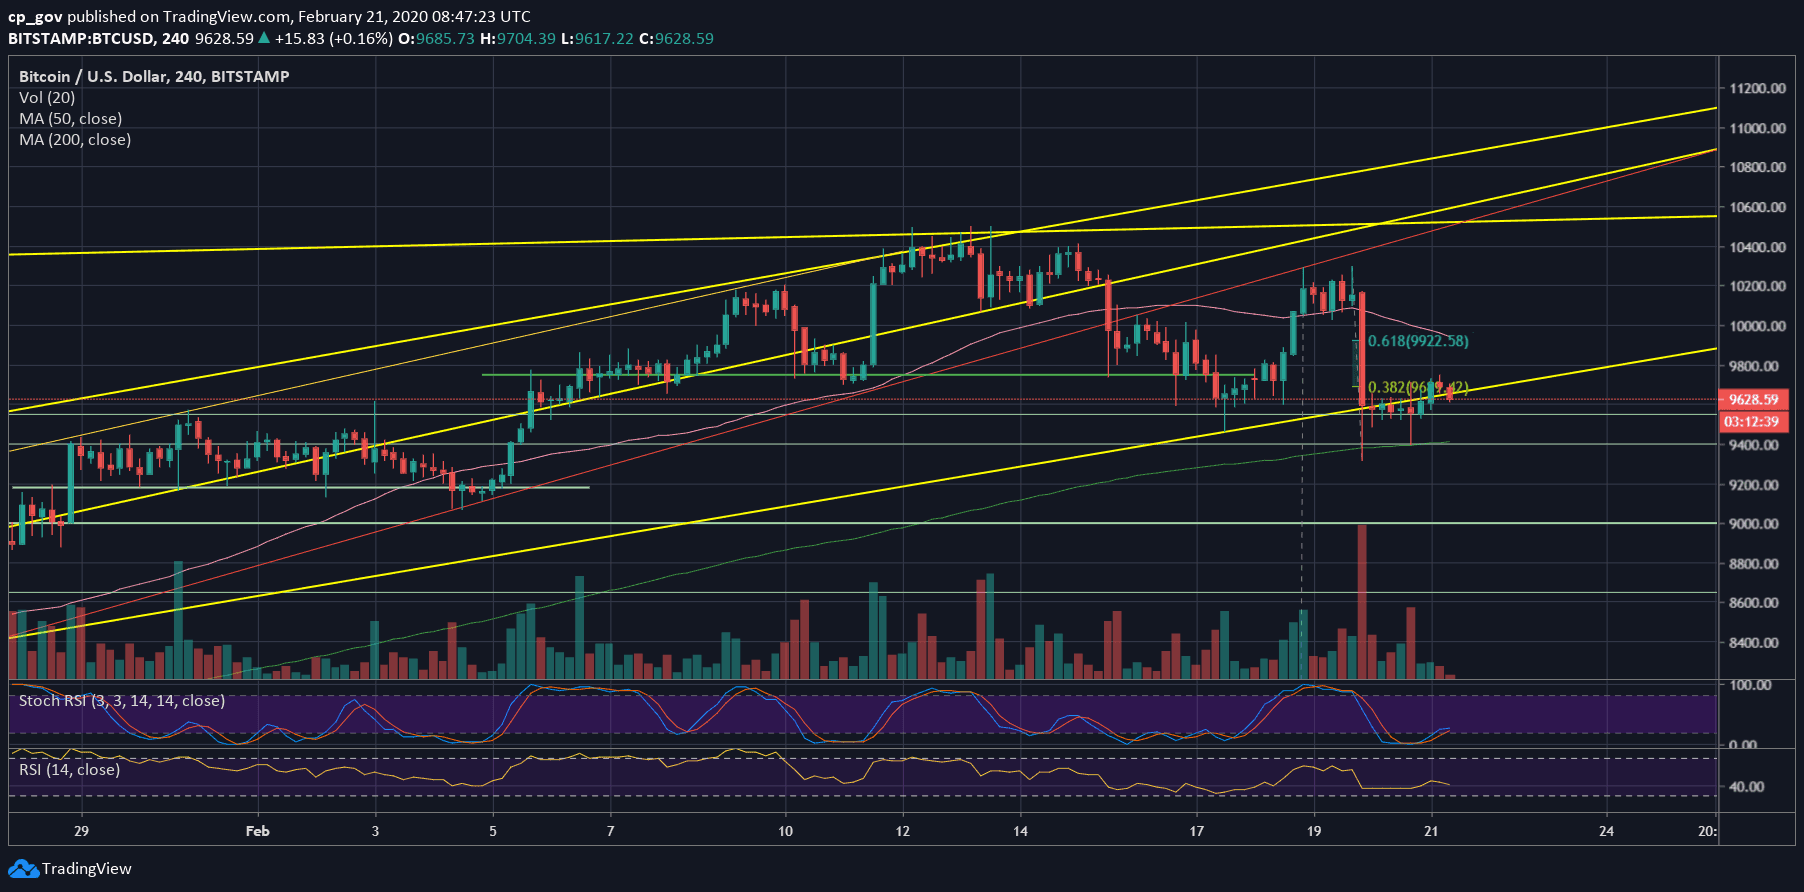
On the lower timeframe – the 4-hour chart, we can see Bitcoin forming a double-top (which is a bearish pattern), before a huge plunge of almost $1000 intraday to the lowest price since February 5 – $9312 (BitStamp).
Following the colossal dump, Bitcoin had recovered a bit, and as of now, failed after testing the first major resistance at $9700, where lies the 38.2% retracement area.
The takeaway from here is that violent moves to one side (up) carrying violent moves to the other side (down), and this is especially true for the volatile cryptocurrencies. Just a reminder, Bitcoin is still up around 30% since 2020 begun, which was not so long ago.
Total Market Cap: $280 billion
Bitcoin Market Cap: $176 billion
BTC Dominance Index: 62.8%
*Data by CoinGecko
– Support/Resistance levels: As mentioned above, the first level of resistance is the $9700, along with the 38.2% Fib retracement level.
Further above lies $9900, which is also the Golden Fib level (61.8%), before the $10,000 benchmark. Higher above lies the current week’s high of $10,200 – $10,300, followed by $10,500 (2020 high).
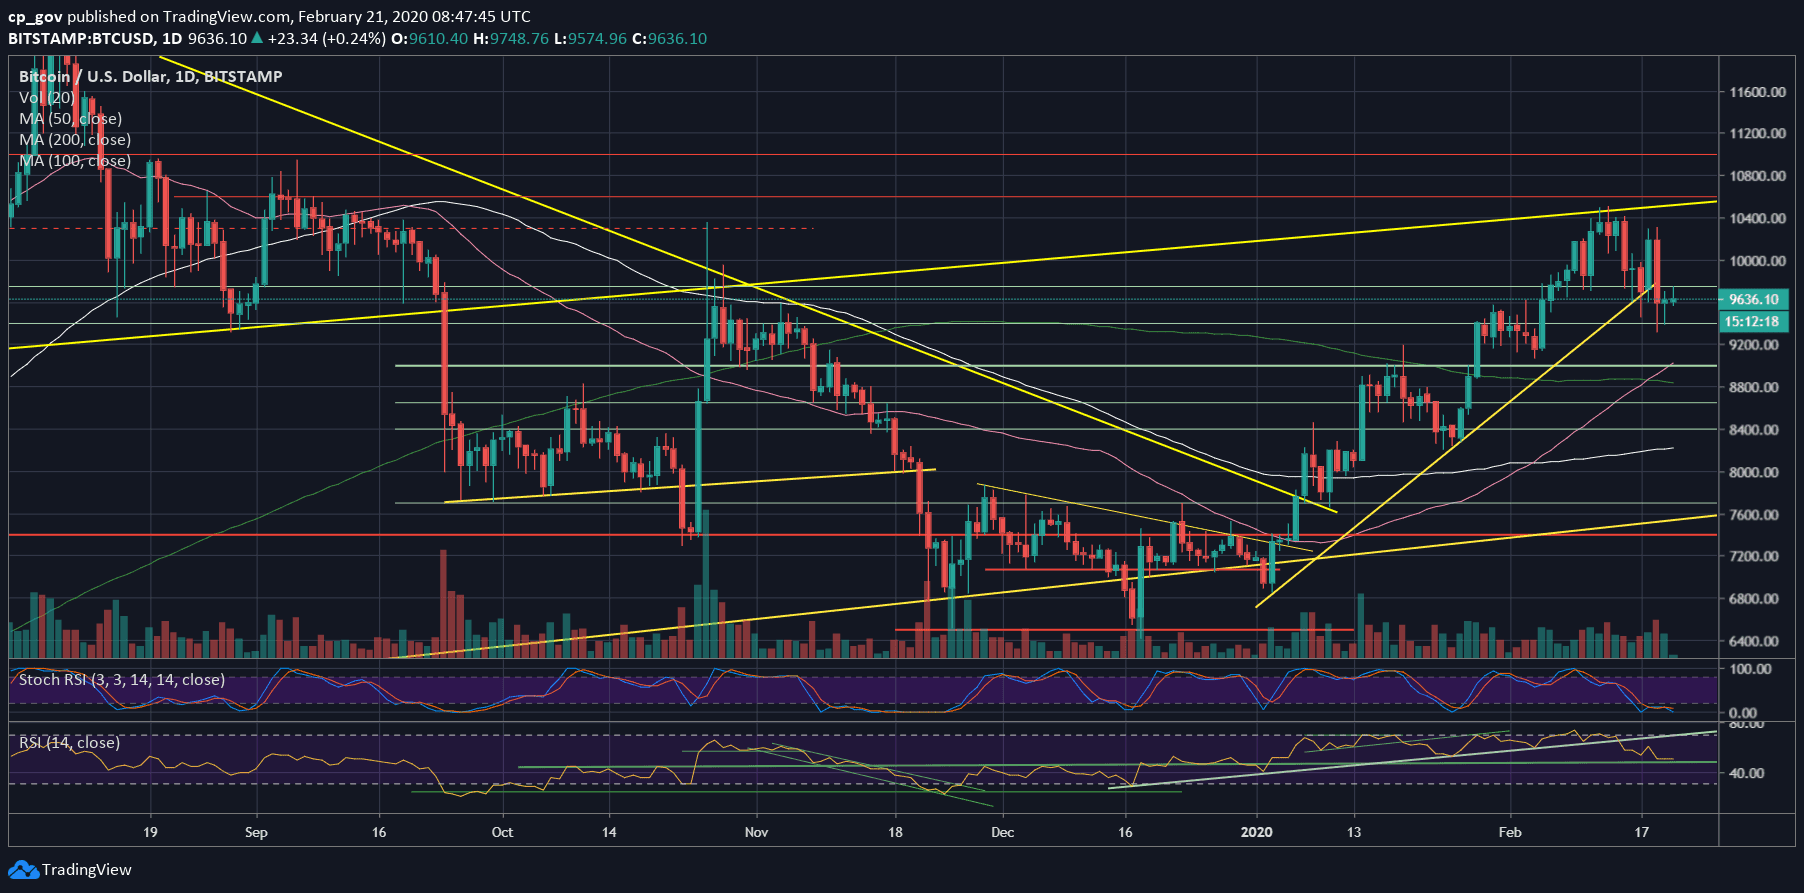
From below, the first significant level of support lies around $9550, followed by $9400, before the low from two days at $9300. In case the latter breaks down, we can expect Bitcoin to retest $9000, which is the 50-days moving average line (marked pink). Further down lies $8800, which is also the significant 200-days moving average line (light green).
– The RSI Indicator: Recent support at 60 was broken down. Now the RSI indicator seeks support upon the significant 50 horizontal RSI level.
The Stochastic RSI oscillator is in the oversold territory; however, the indicator rolled over after making a crossover.
– Trading volume: Wednesday’s volume was the highest in February. The dump was followed by a massive amount of volume ($100 million of longs were liquidated only on BitMEX). However, the volume is not high and significant as the peak volume of January.