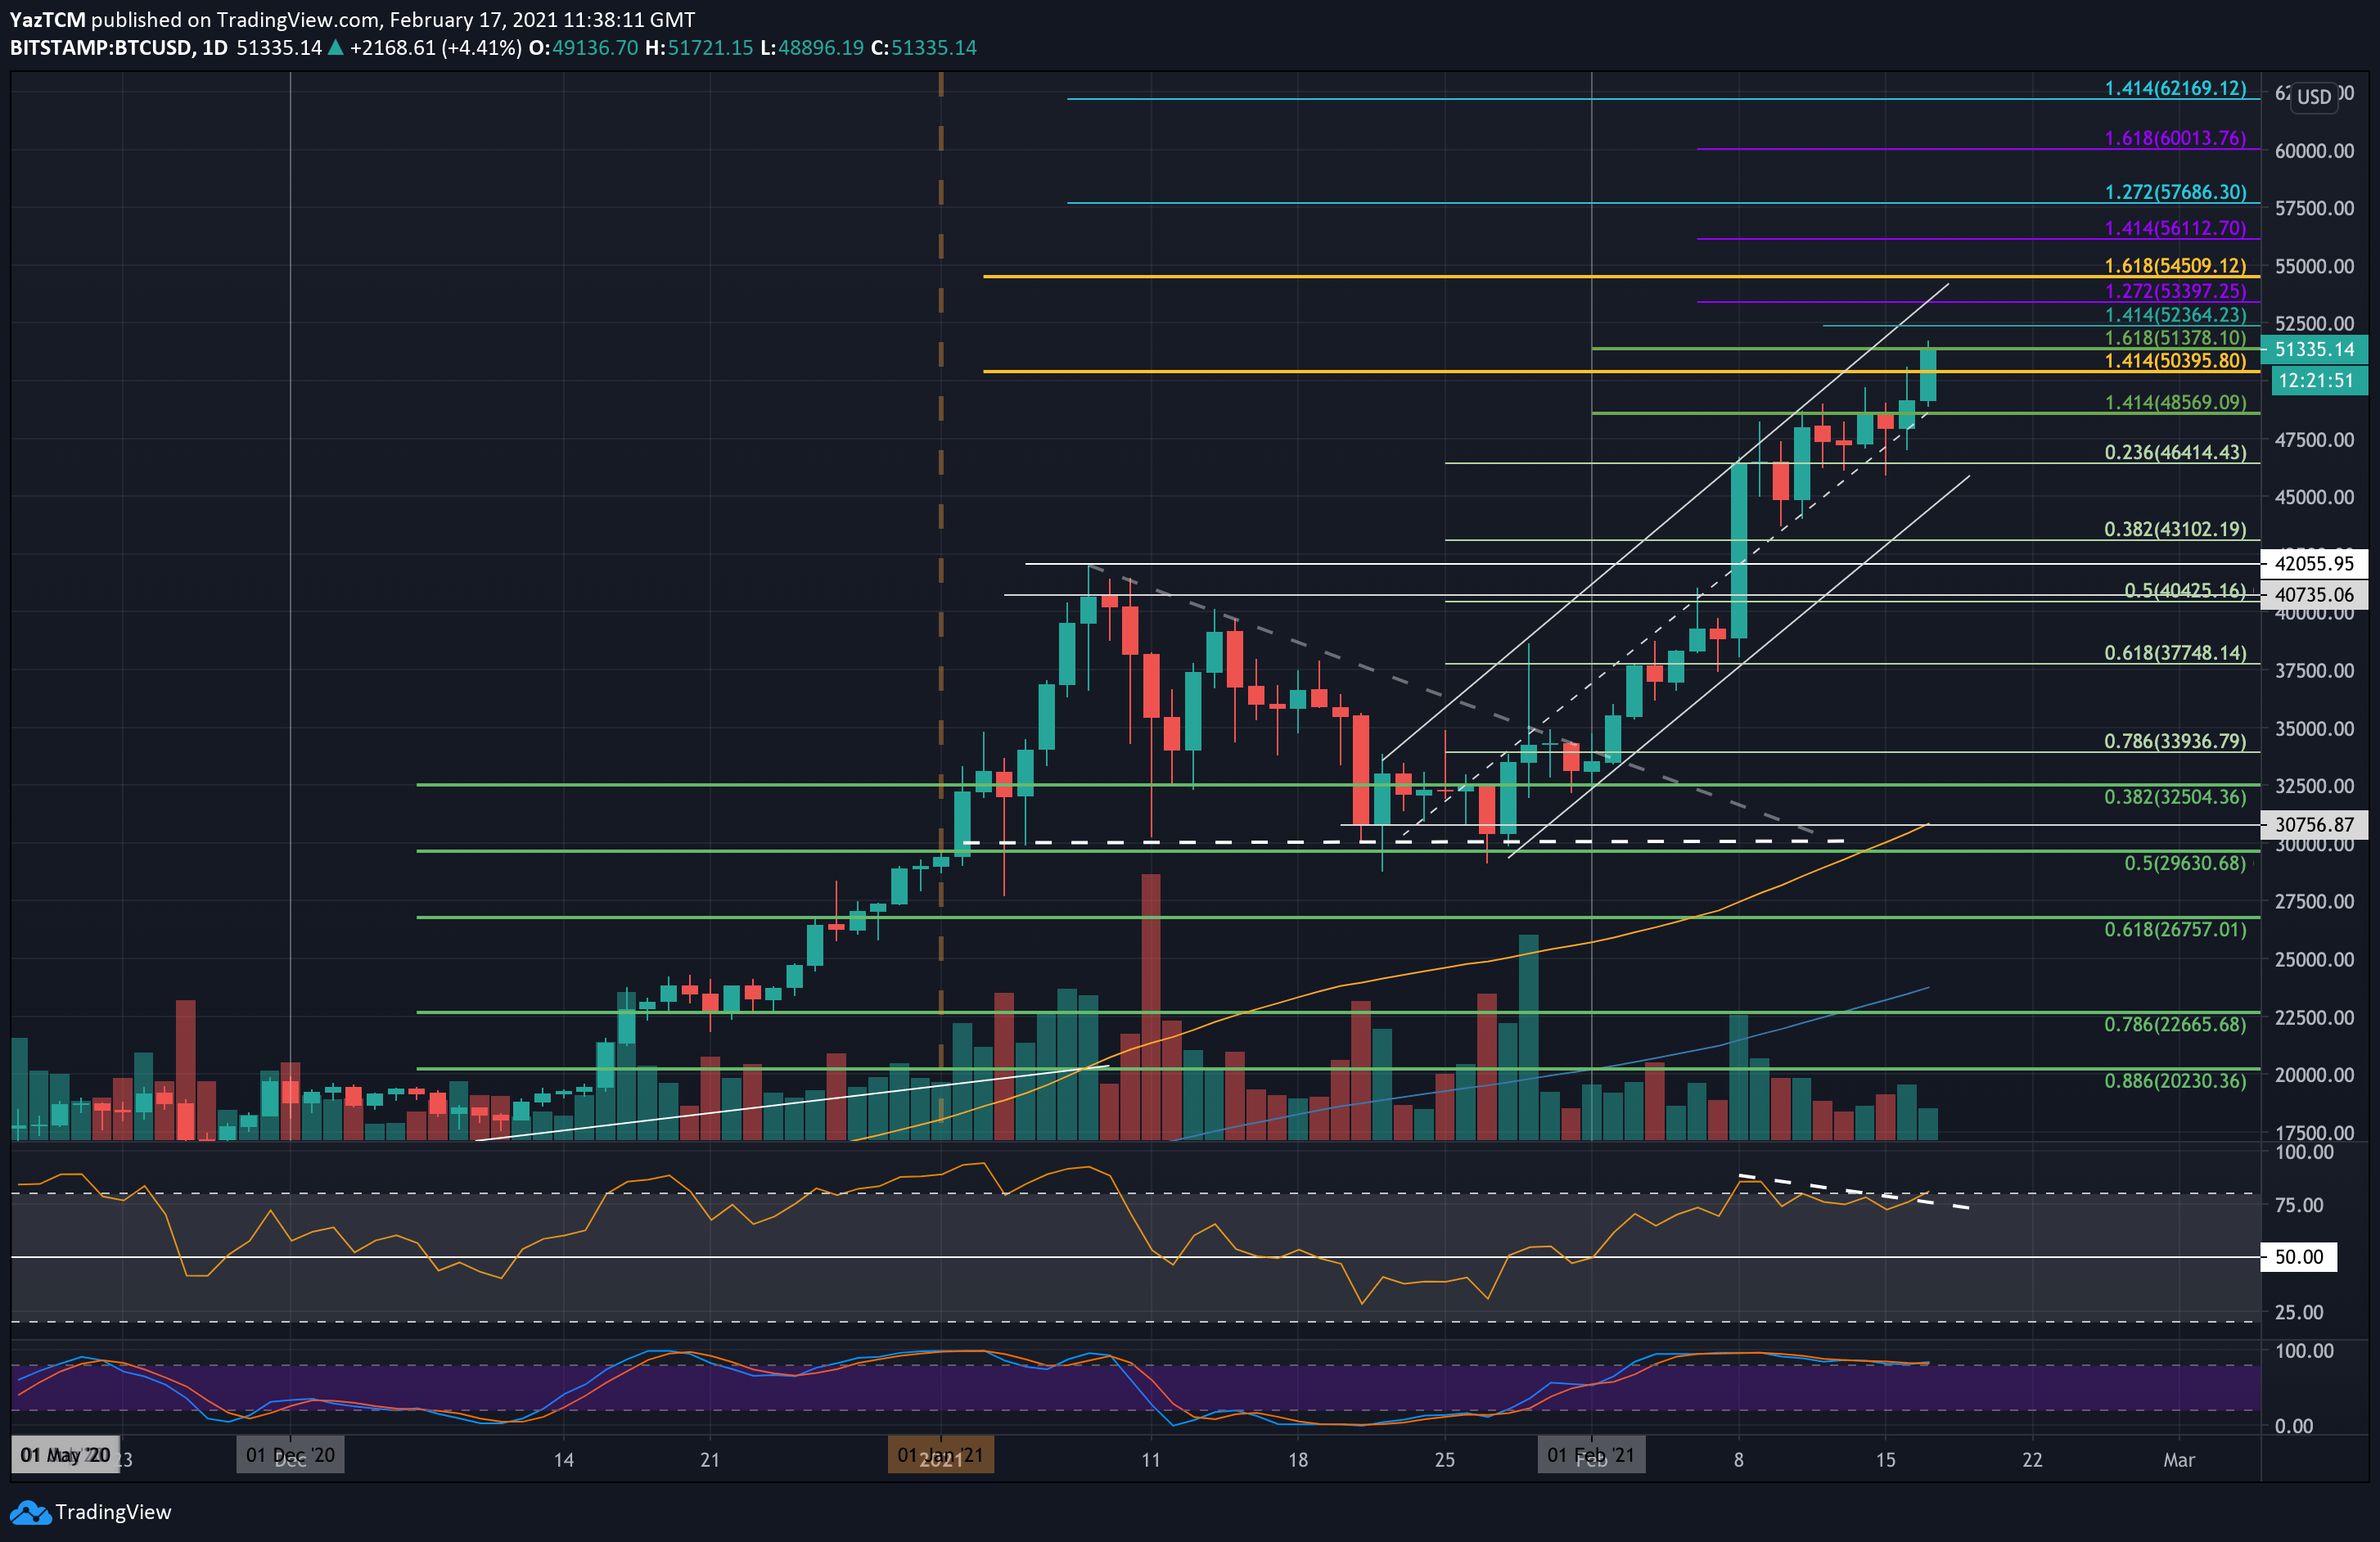
BTC/USD Daily Chart. Source: TradingView
Bitcoin price surged by a total of 5% over the past 24 hours, as the coin finally exceeds the $50,000 milestone.
Just nine days ago, the primary cryptocurrency had broken above the January-2021 previous ATH at $42,000, on the day Tesla disclosed its $1.5 billion Bitcoin purchase.
BTC then saw its largest-ever daily price candle, and encountered resistance at $48,570 (1.414 Fib Extension – green), struggling with it over the past few days till finally managing to close a daily candle above that during the weekend.
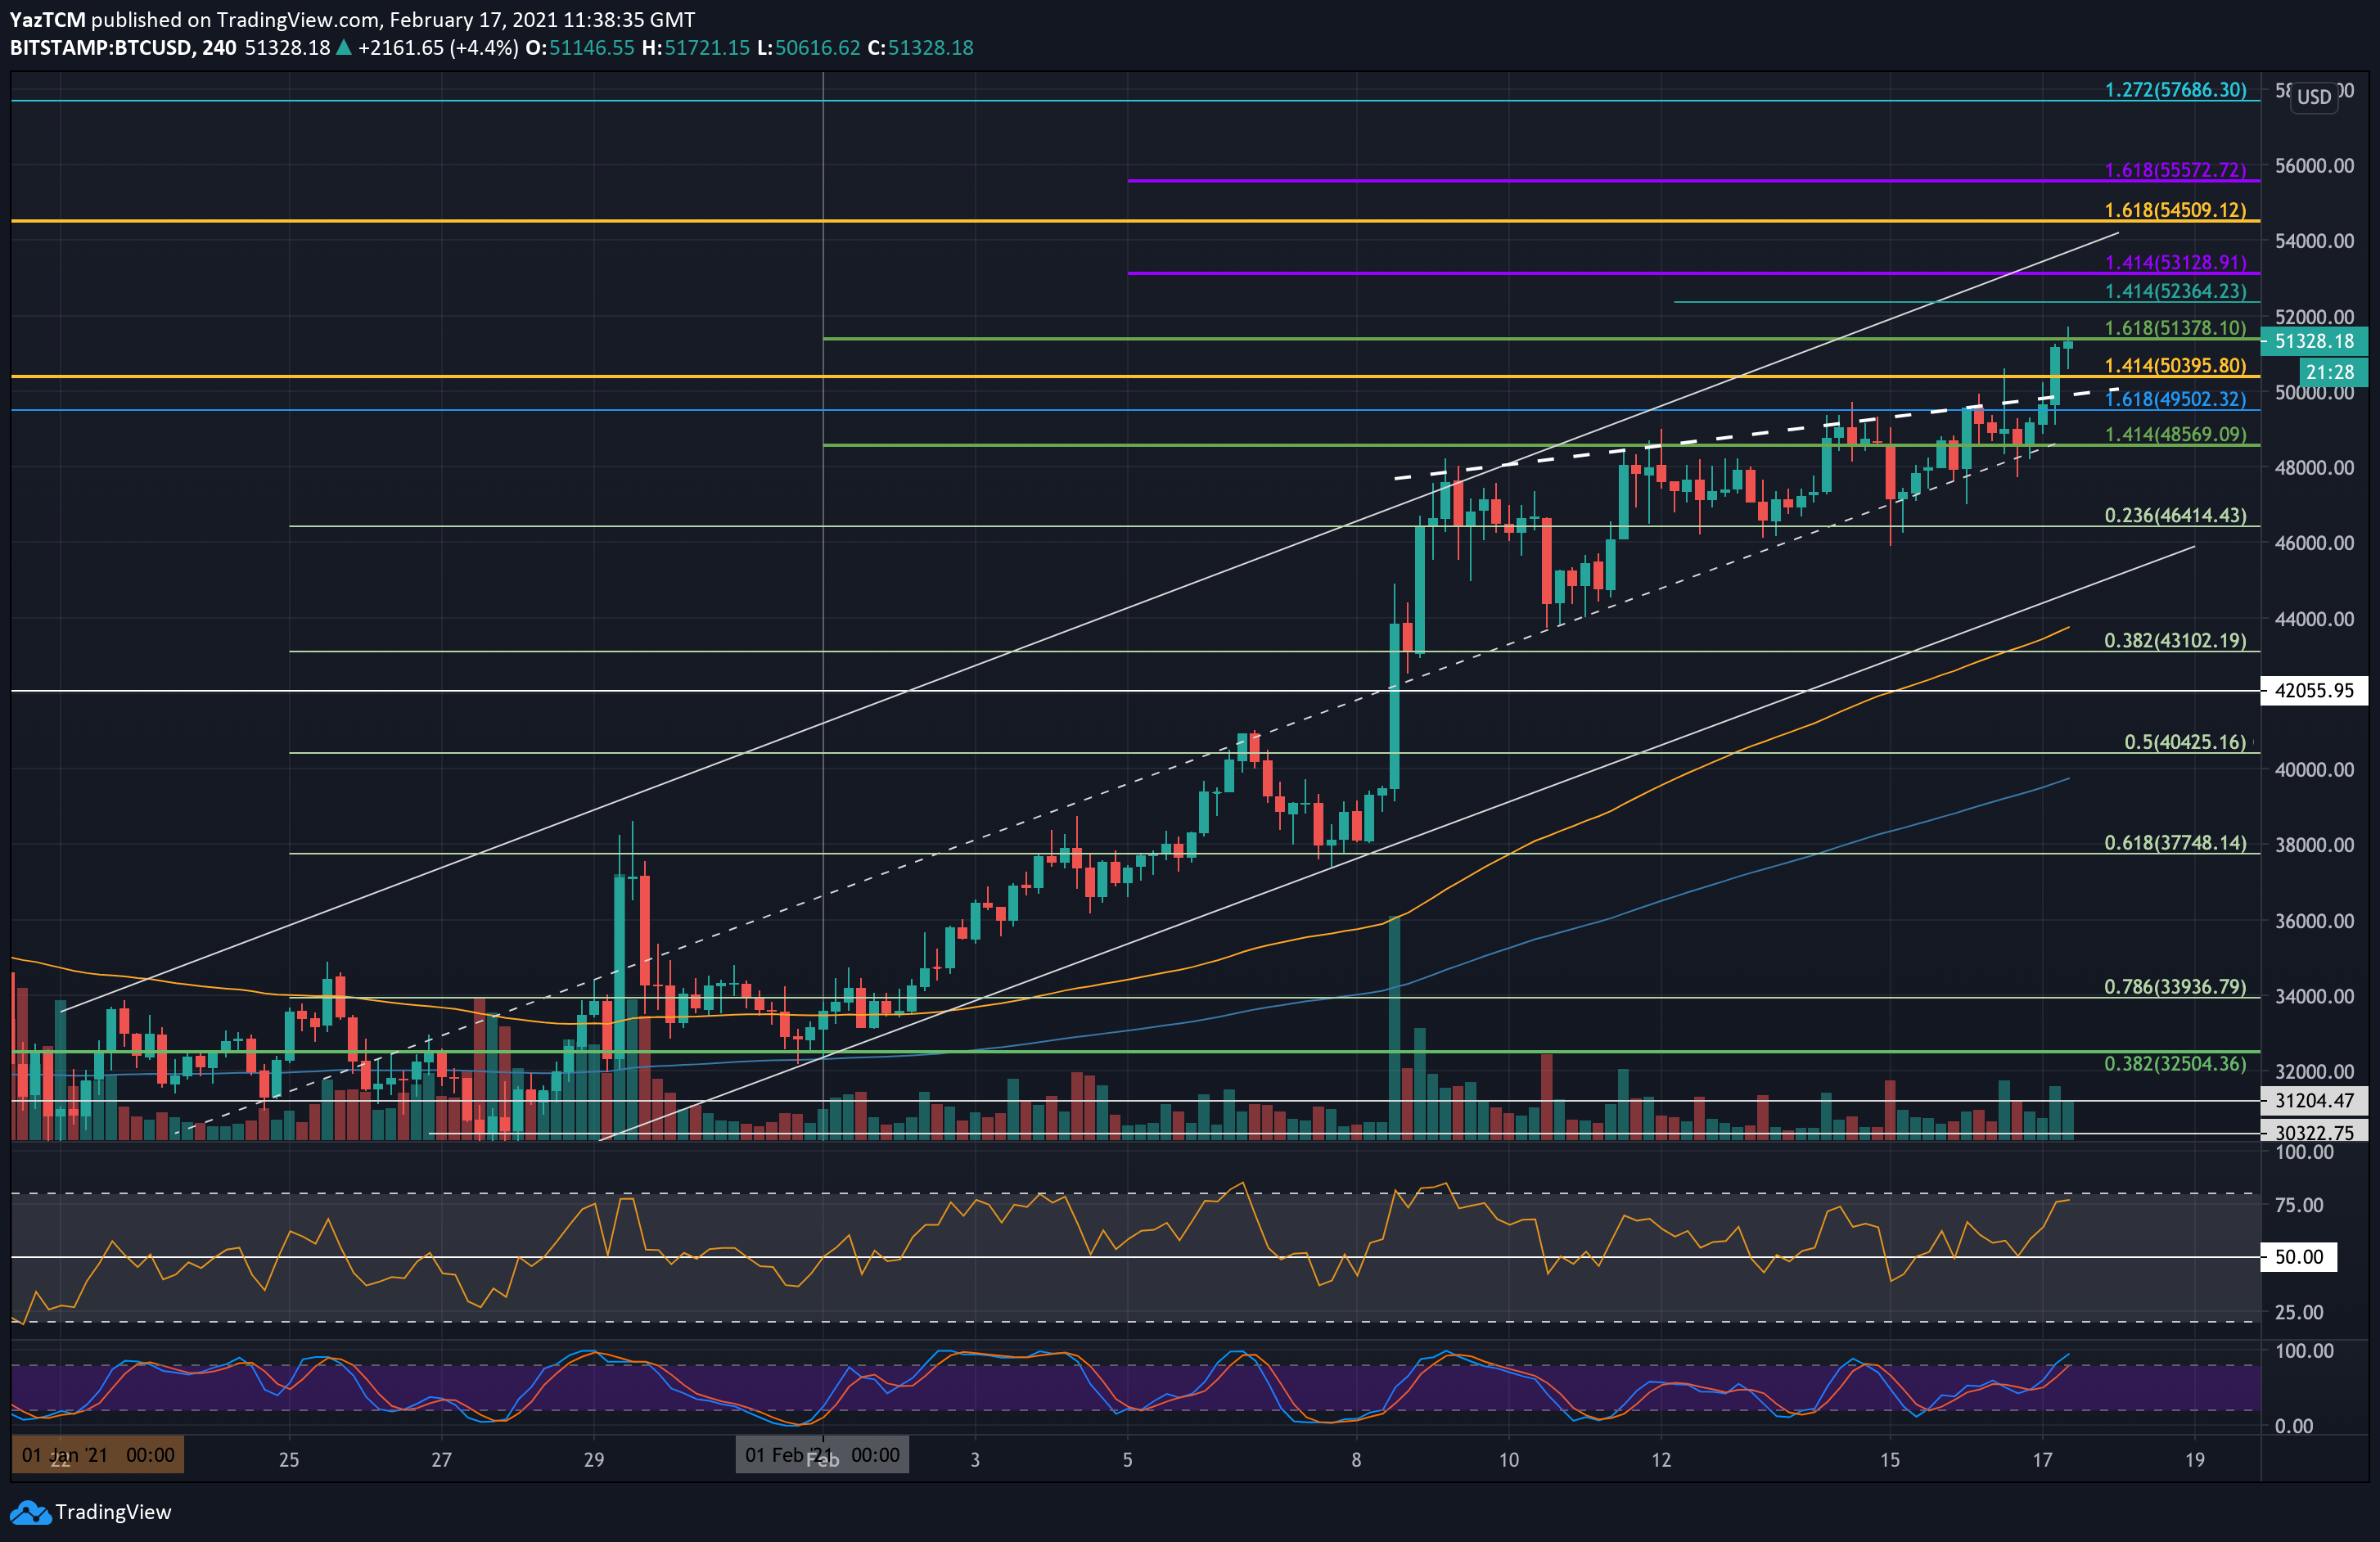
As shown on the following short term’s 4-hour chart, Bitcoin has been trading inside an ascending price channel since the end of January. Over the past week, it found support upon the channel’s equilibrium (midline) as support maintained the rising trend.
Over the past two days, Bitcoin had found resistance at $49,500 and struggled to break above it. Thus, forming a rising wedge pattern, which is typically a bearish pattern.
Unfortunately to the bears, we saw a bullish breakout to the upside – allowing BTC to surpass $50,000 and reach the $51,378 resistance (1.618 Fib Extension – green), where it is currently trading now.
Key Support Levels: $50,000, $48,570, $46,414, $45,000, $43,100.
Key Resistance Levels: $51,378, $52,365, $54,500, $56,112, $57,686, $60,000.
Looking ahead, the first level of resistance beyond $51,400 lies at $52,365 (1.414 Fib Extension – turquoise). This is followed by $54,500 (1.618 FIb Extension – yellow & the upper boundary of the channel), and $56,112 (1.414 Fib Extension – purple), $57,686 (1.272 Fib Extension – blue) and $60,000.
On the other side, the first level of support lies at $50,000. This is followed by $48,570 (previous resistance & the midline of the price channel), $46,414 (.236 Fib & lower boundary of the price channel), and $45,000. Further support lies at $43,100 (.382 Fib) and $42,000.
The daily RSI is now at its highest level since February 9, invalidating the bearish divergence, which is fading away. However, on the longer timeframes – the weekly – there is still bearish divergence, which requires a correction at some point.
In the short term, the RSI is nearing its overbought area but still has room before the market becomes overextended.