Over the past day or so, Bitcoin suffered from a massive price correction. After reaching the $10K zone for the second time in 10 days, Friday’s devastating candle saw a huge drop of over $800 to $9112, which is the current low on Bitstamp.
If you had read our previous price analysis from Thursday, you can’t be surprised. Along with calling the $9800 – $10,000 the “real test” for Bitcoin’s short-term, we also mentioned that the parabolic move since the halving “better slow down because we all know how Bitcoin parabolic moves end up.”
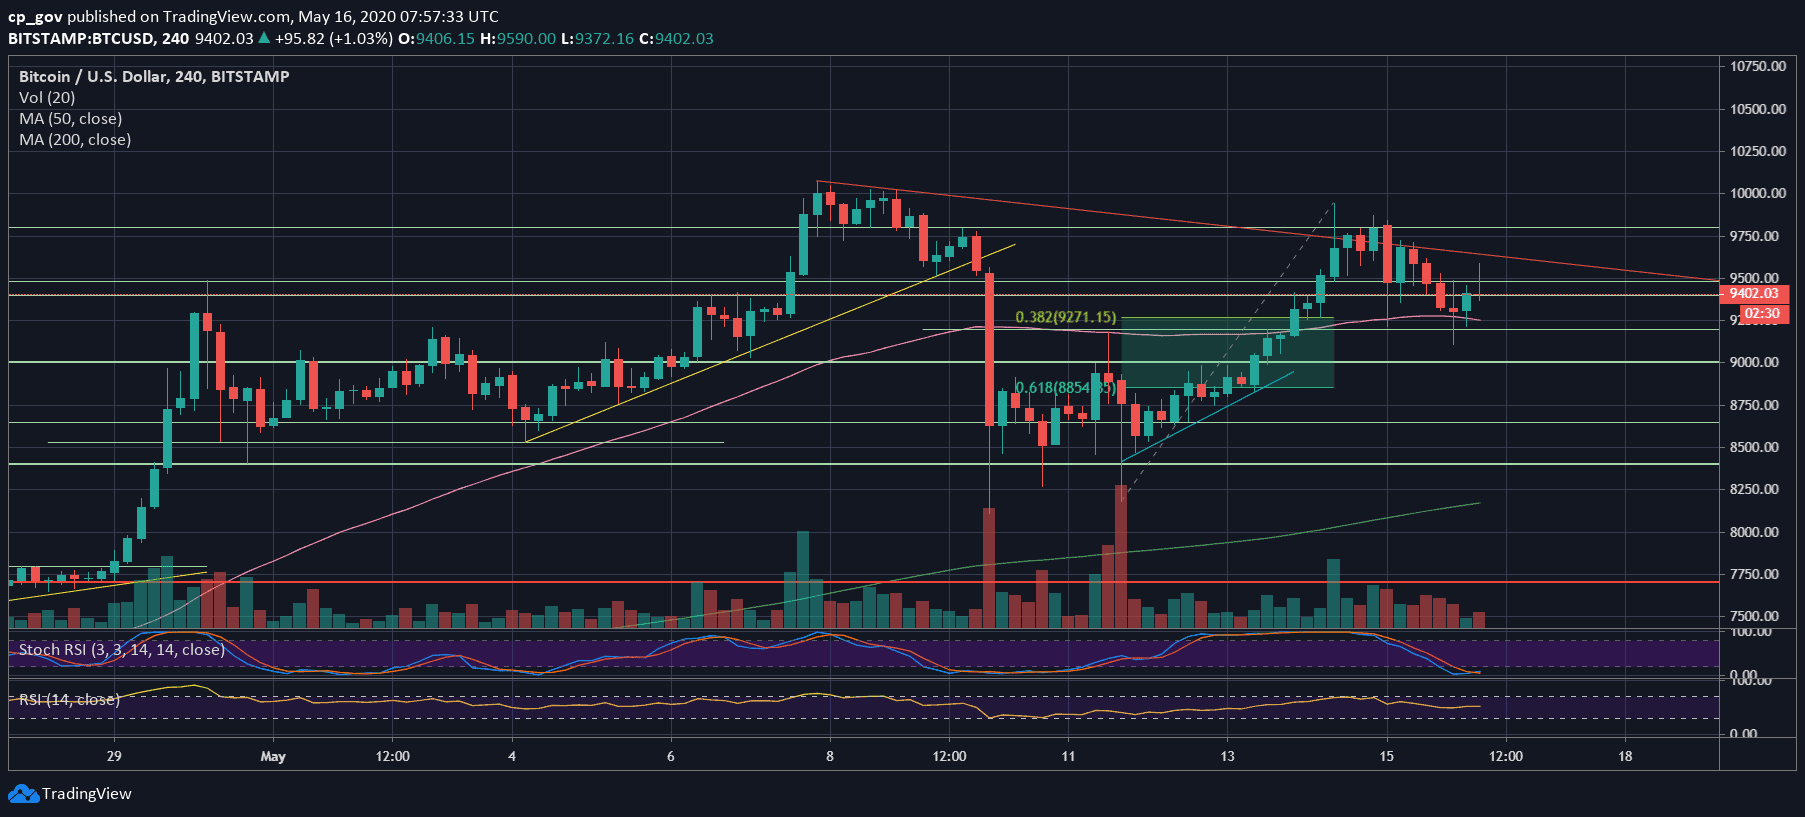
There are some good news: As can be seen on the following 4-hour chart, Bitcoin maintained the 38.2% Fibonacci retracement level of $9270, along with the MA-50 (pink line) on the 4-hour chart.
At its first drop to these levels, the 4-hour candle reached around the mentioned area before a rapid pull-back. However, at the second drop, Bitcoin declined to $9112, but the candles’ bodies still maintained the $9300 support and closed above the MA-50, or the pink line.
This does not mean that the correction is over, or Bitcoin is saved from seeing $8K prefix again, but as long as the $9300 is kept, the bulls are here for the short-term.
As we stated in the latest price analysis when Bitcoin was trading around $9700: “even forming a higher low at $9200 – $9300 will be considered healthy and bullish.”
Total Market Cap: $258 billion
Bitcoin Market Cap: $173.5 billion
BTC Dominance Index: 67.2%
*Data by CoinGecko
As of writing these lines, Bitcoin is trading around the $9400 – $9500 confluence zone. The first level of resistance now lies by the descending short-term trend-line at around $9630, which is marked red on the 4-hour chart.
In case of a breakout, the next level of resistance would then be $9800, followed by Thursday’s high at $9950 – $10,000.
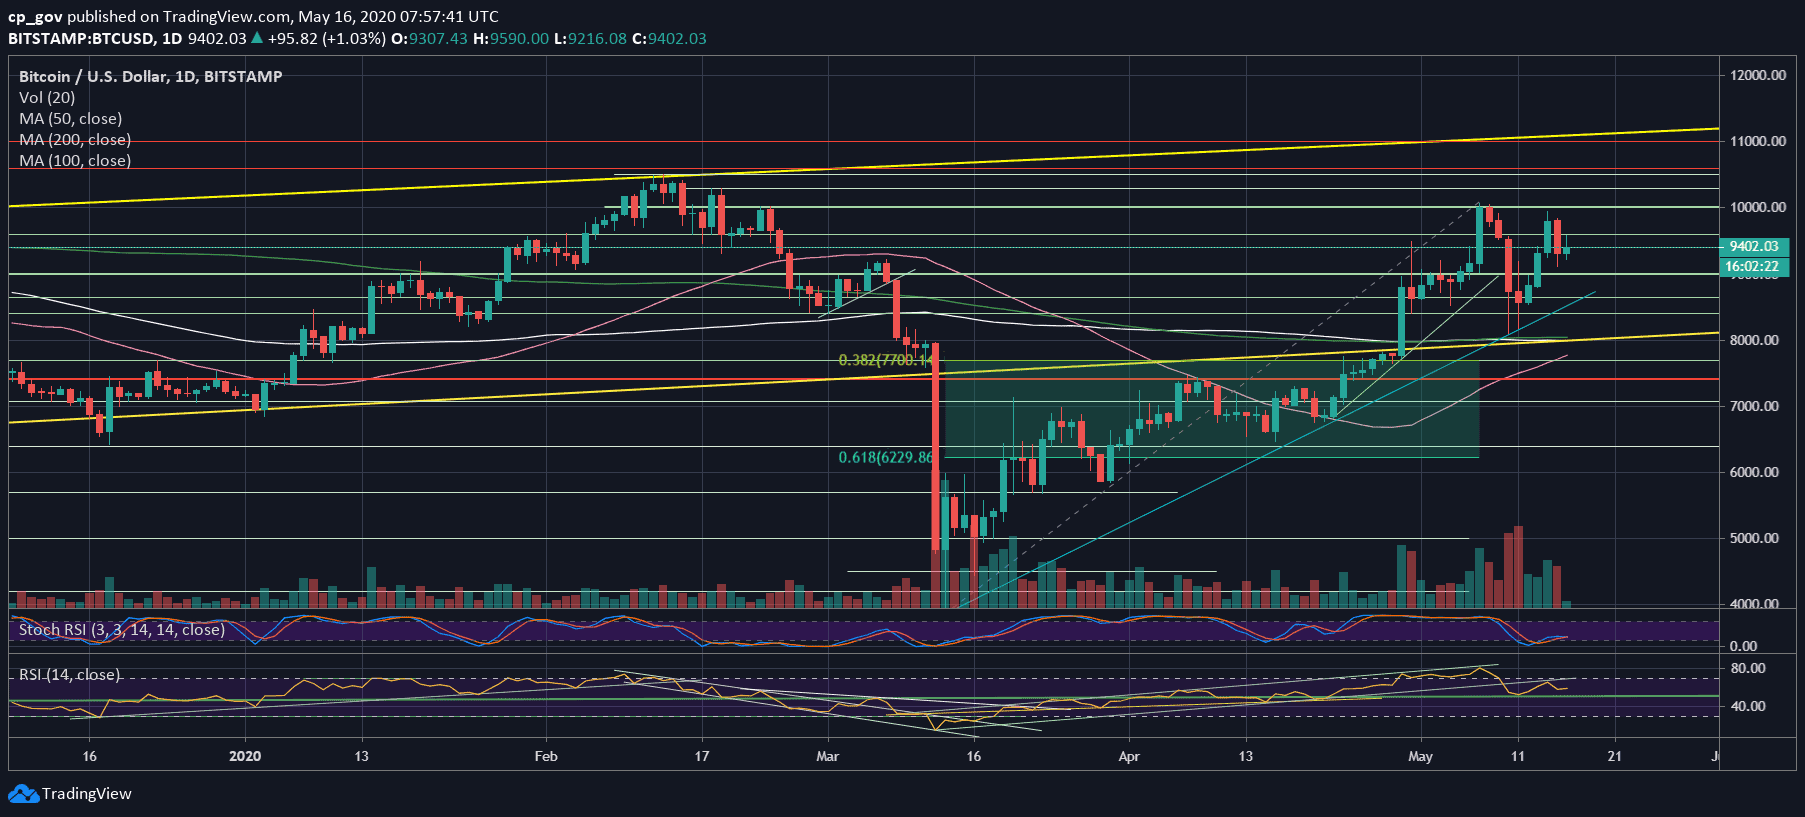
From below, the first support now lies at $9300, followed by $9100, that is yesterday’s lowest price. Further down lies the old resistance turned support of $8850 – 8900, along with the Golden Fibonacci retracement level of 61.8%. This also includes the blue ascending trend-line on the daily chart. Further below lies $8650 and $8400.
Looking at the daily chart’s RSI indicator, we can identify some bearish divergence, along with lower lows forming. As we stated here on Thursday, the RSI reached the ascending trend-line around 65-66, confirmed it as support turned resistance, before plunging to create a fresh lower low.
In case Bitcoin would like to reach higher levels and 5-digit numbers, the RSI must overcome this lower-lows pattern.
Looking at the last month’s average volume levels, we can see that despite the price rally on Thursday, the volume levels were far lower than the highest volume days of May, including the halving.