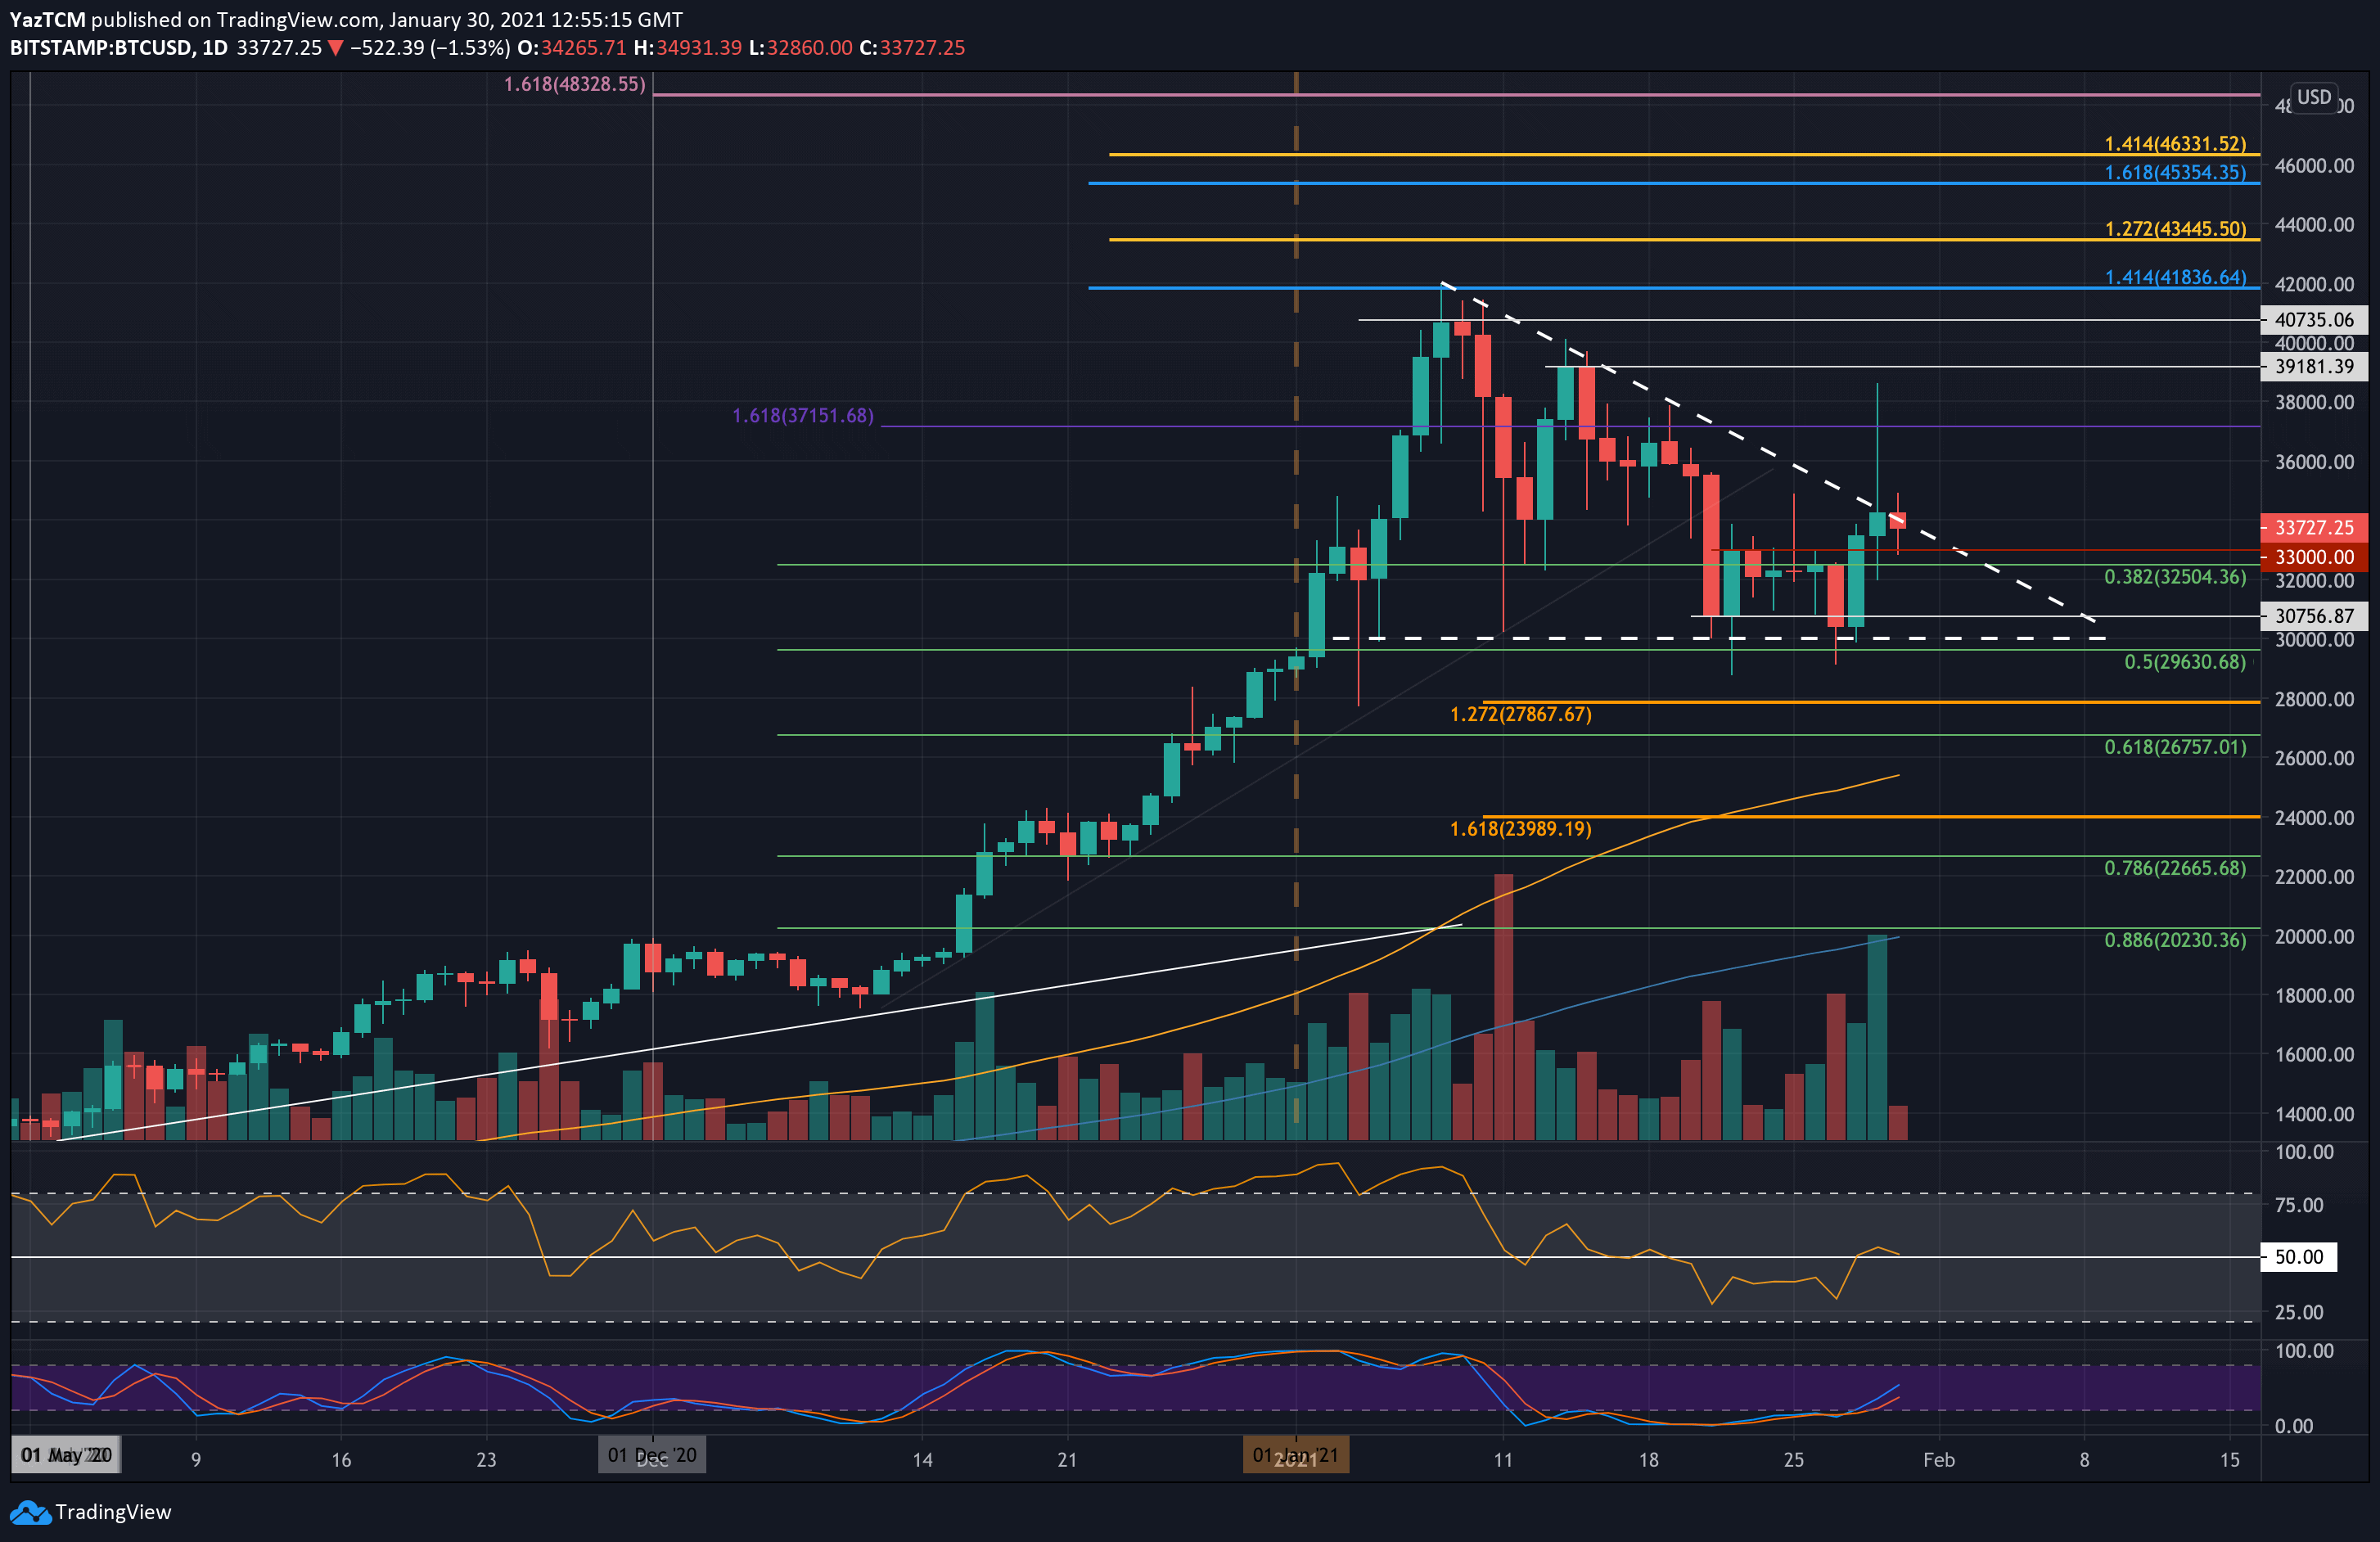
BTC/USD Daily Chart. Source: TradingView
The BTC rollercoaster continues. The primary cryptocurrency had started to climb from $30,000 on Thursday as it broke the previous week’s range by pushing above $33,000.
On Friday, a Tweet and a bio change from Elon Musk sent Bitcoin soaring as it broke this descending triangle and went as high as $38,620 (Bitstamp).
Unfortunately, this push higher was short-lived. Eventually, Bitcoin reversed toward the end of the day as it dropped by a total of $4,400 to close the daily candle inside the descending triangle again – giving a false breakout signal for those that entered before the daily candle closed.
Today, Bitcoin spiked lower, hitting as low as $33,000 before bouncing again for a partial recovery, where it is trading as of writing these lines. The bigger picture, amid the false breakout, points out that Bitcoin is still trading inside the same descending triangle.
Key Support Levels: $33,000, $32,500, $32,000, $31,200, $30,760, $30,300.
Key Resistance Levels: $34,000, $34,450, $35,000, $35,790, $36,500.
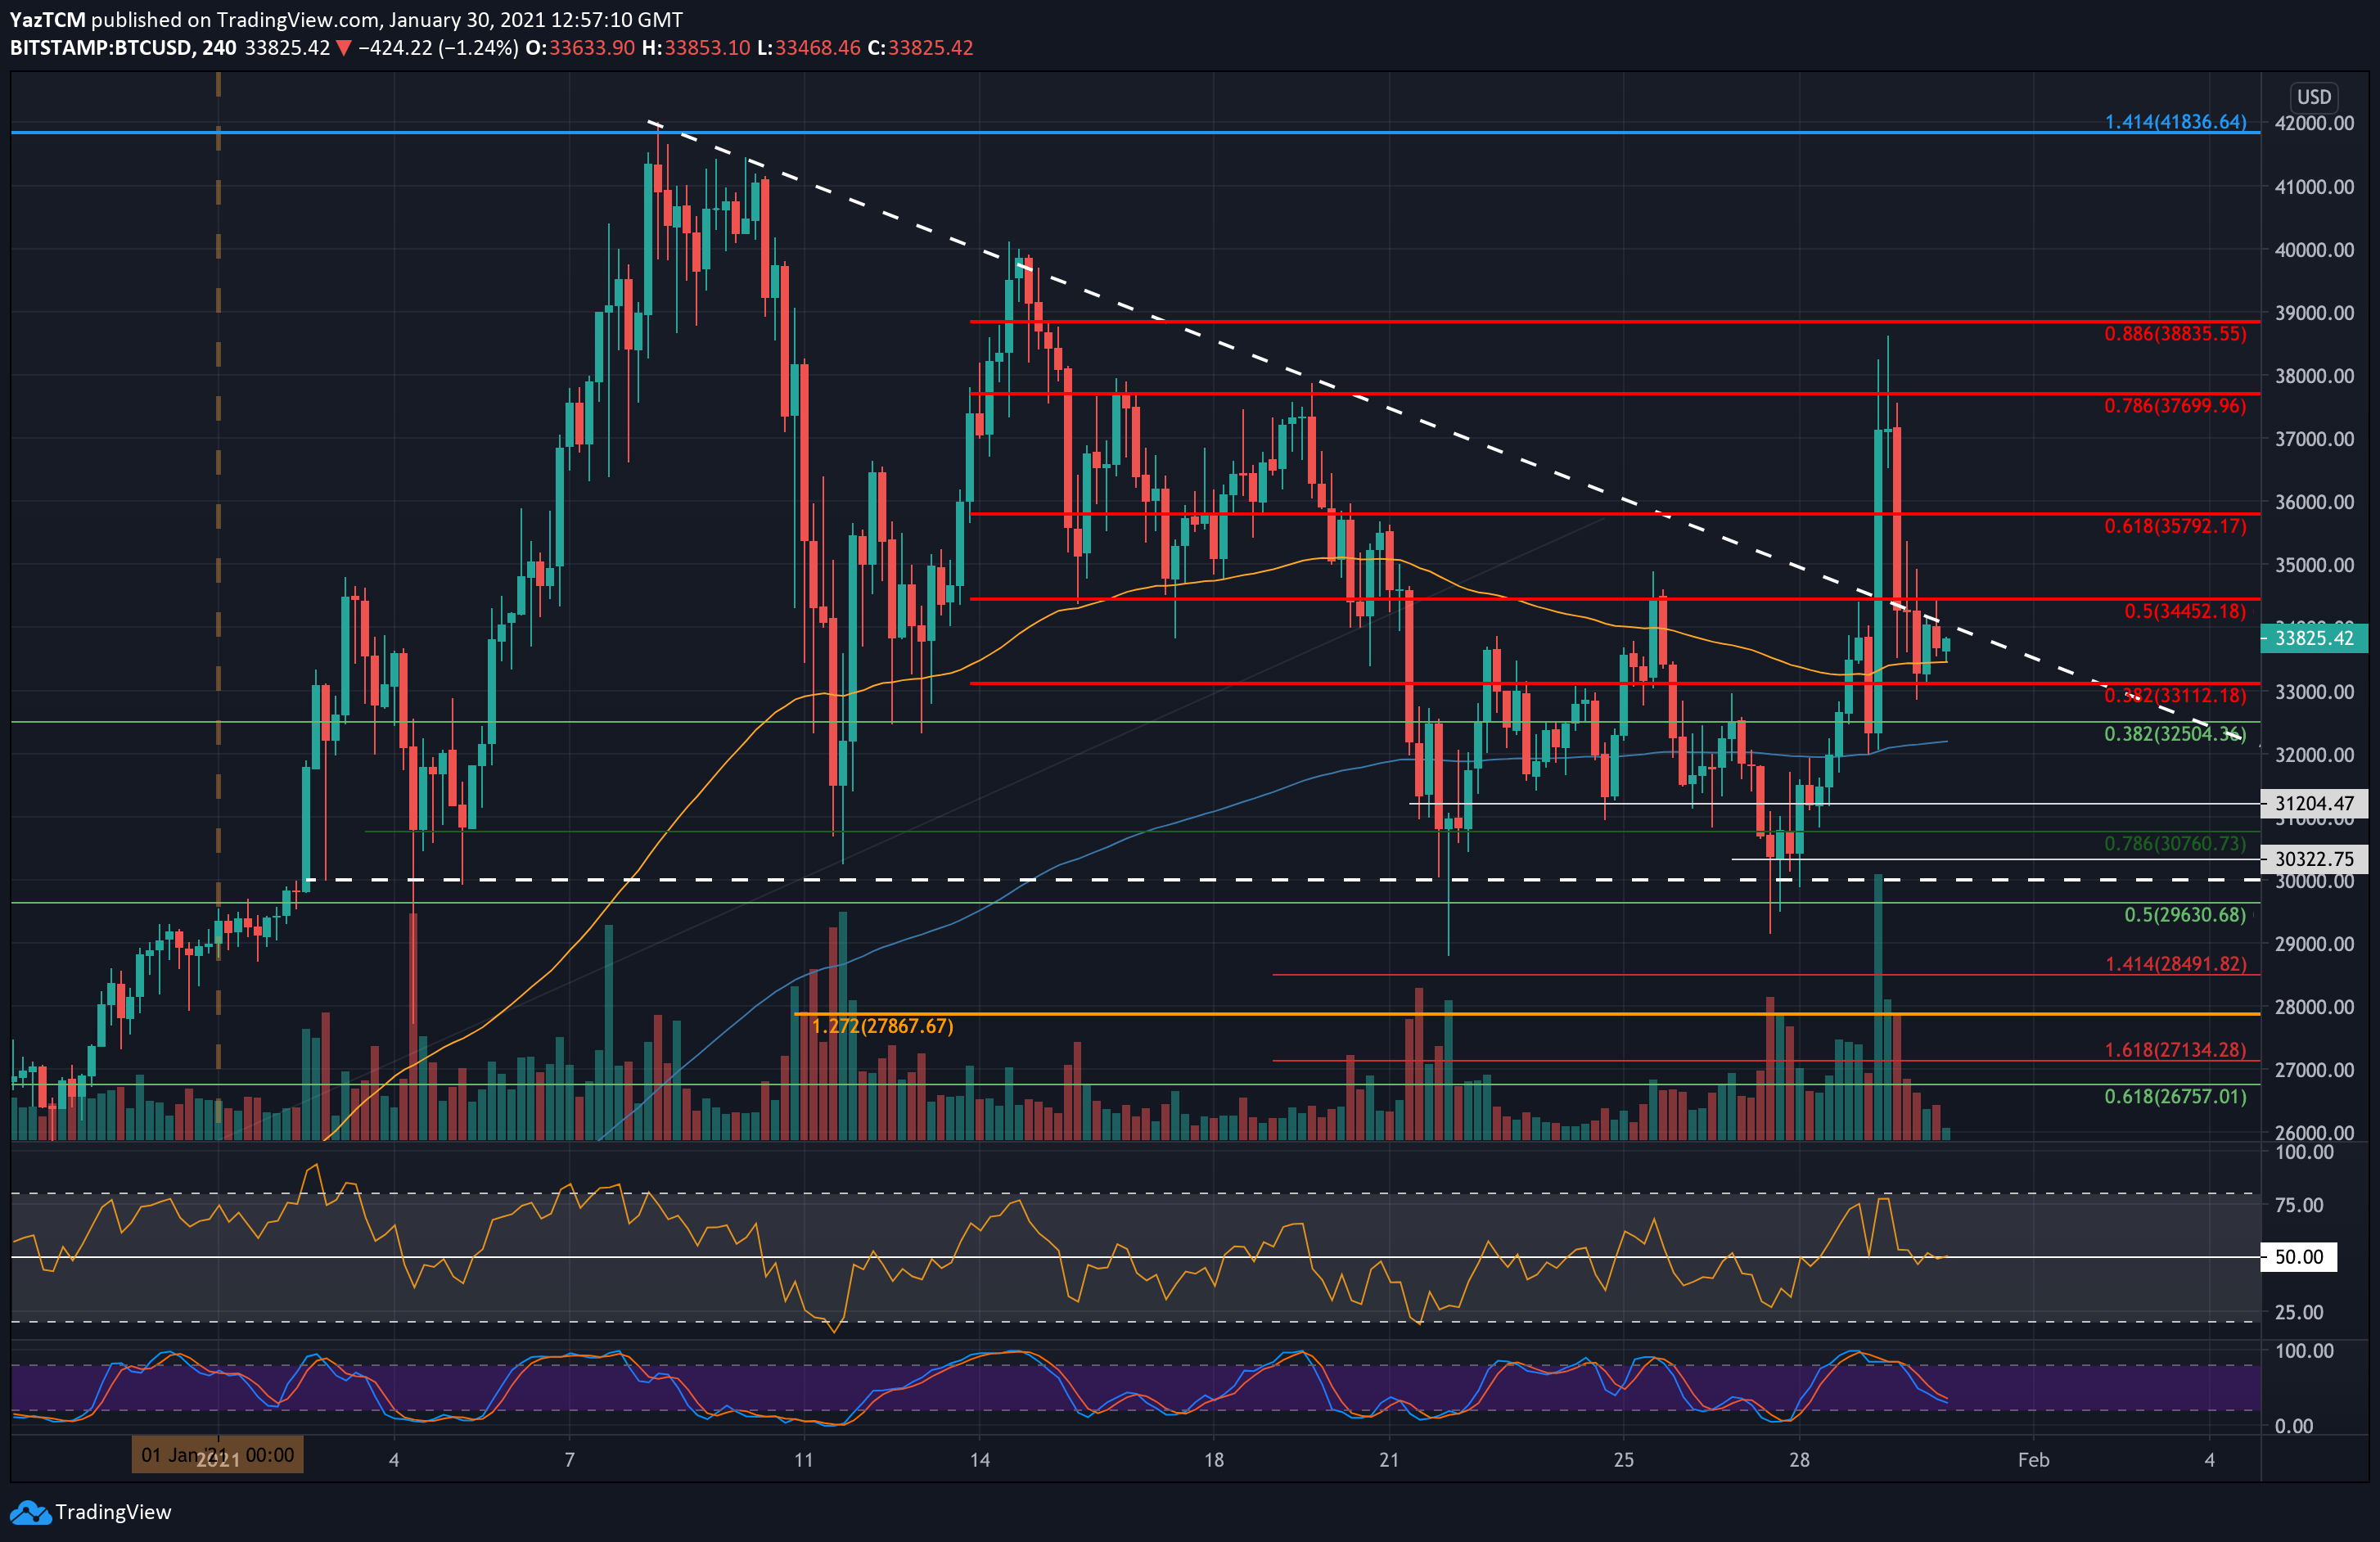
Moving forward, the first resistance lies at the upper angle of the descending triangle, around $34,000. This is followed by $34,450 (bearish .5 Fib), $35,000, $35,790 (bearish .618 Fib), and $36,500.
The next targets lie at $37,100 (resistance from Friday), $37,700 (bearish .786 Fib), and $38,650 (yesterday’s daily high).
On the other side, the first support lies at $33,000. This is followed by $32,500 (.382 Fib), $32,000, and $31,200. Additional support is found at $30,760 (short term .786 Fib), and $30,320, which is the 50-day moving average line.
The daily RSI attempted to break the midline over the past three days but did not reach too far above. It has returned to the midline as indecision looms within the market. For a positive breakout of the triangle, the RSI must rise higher to indicate bullish momentum is increasing, along with the trading volume following the breakout.