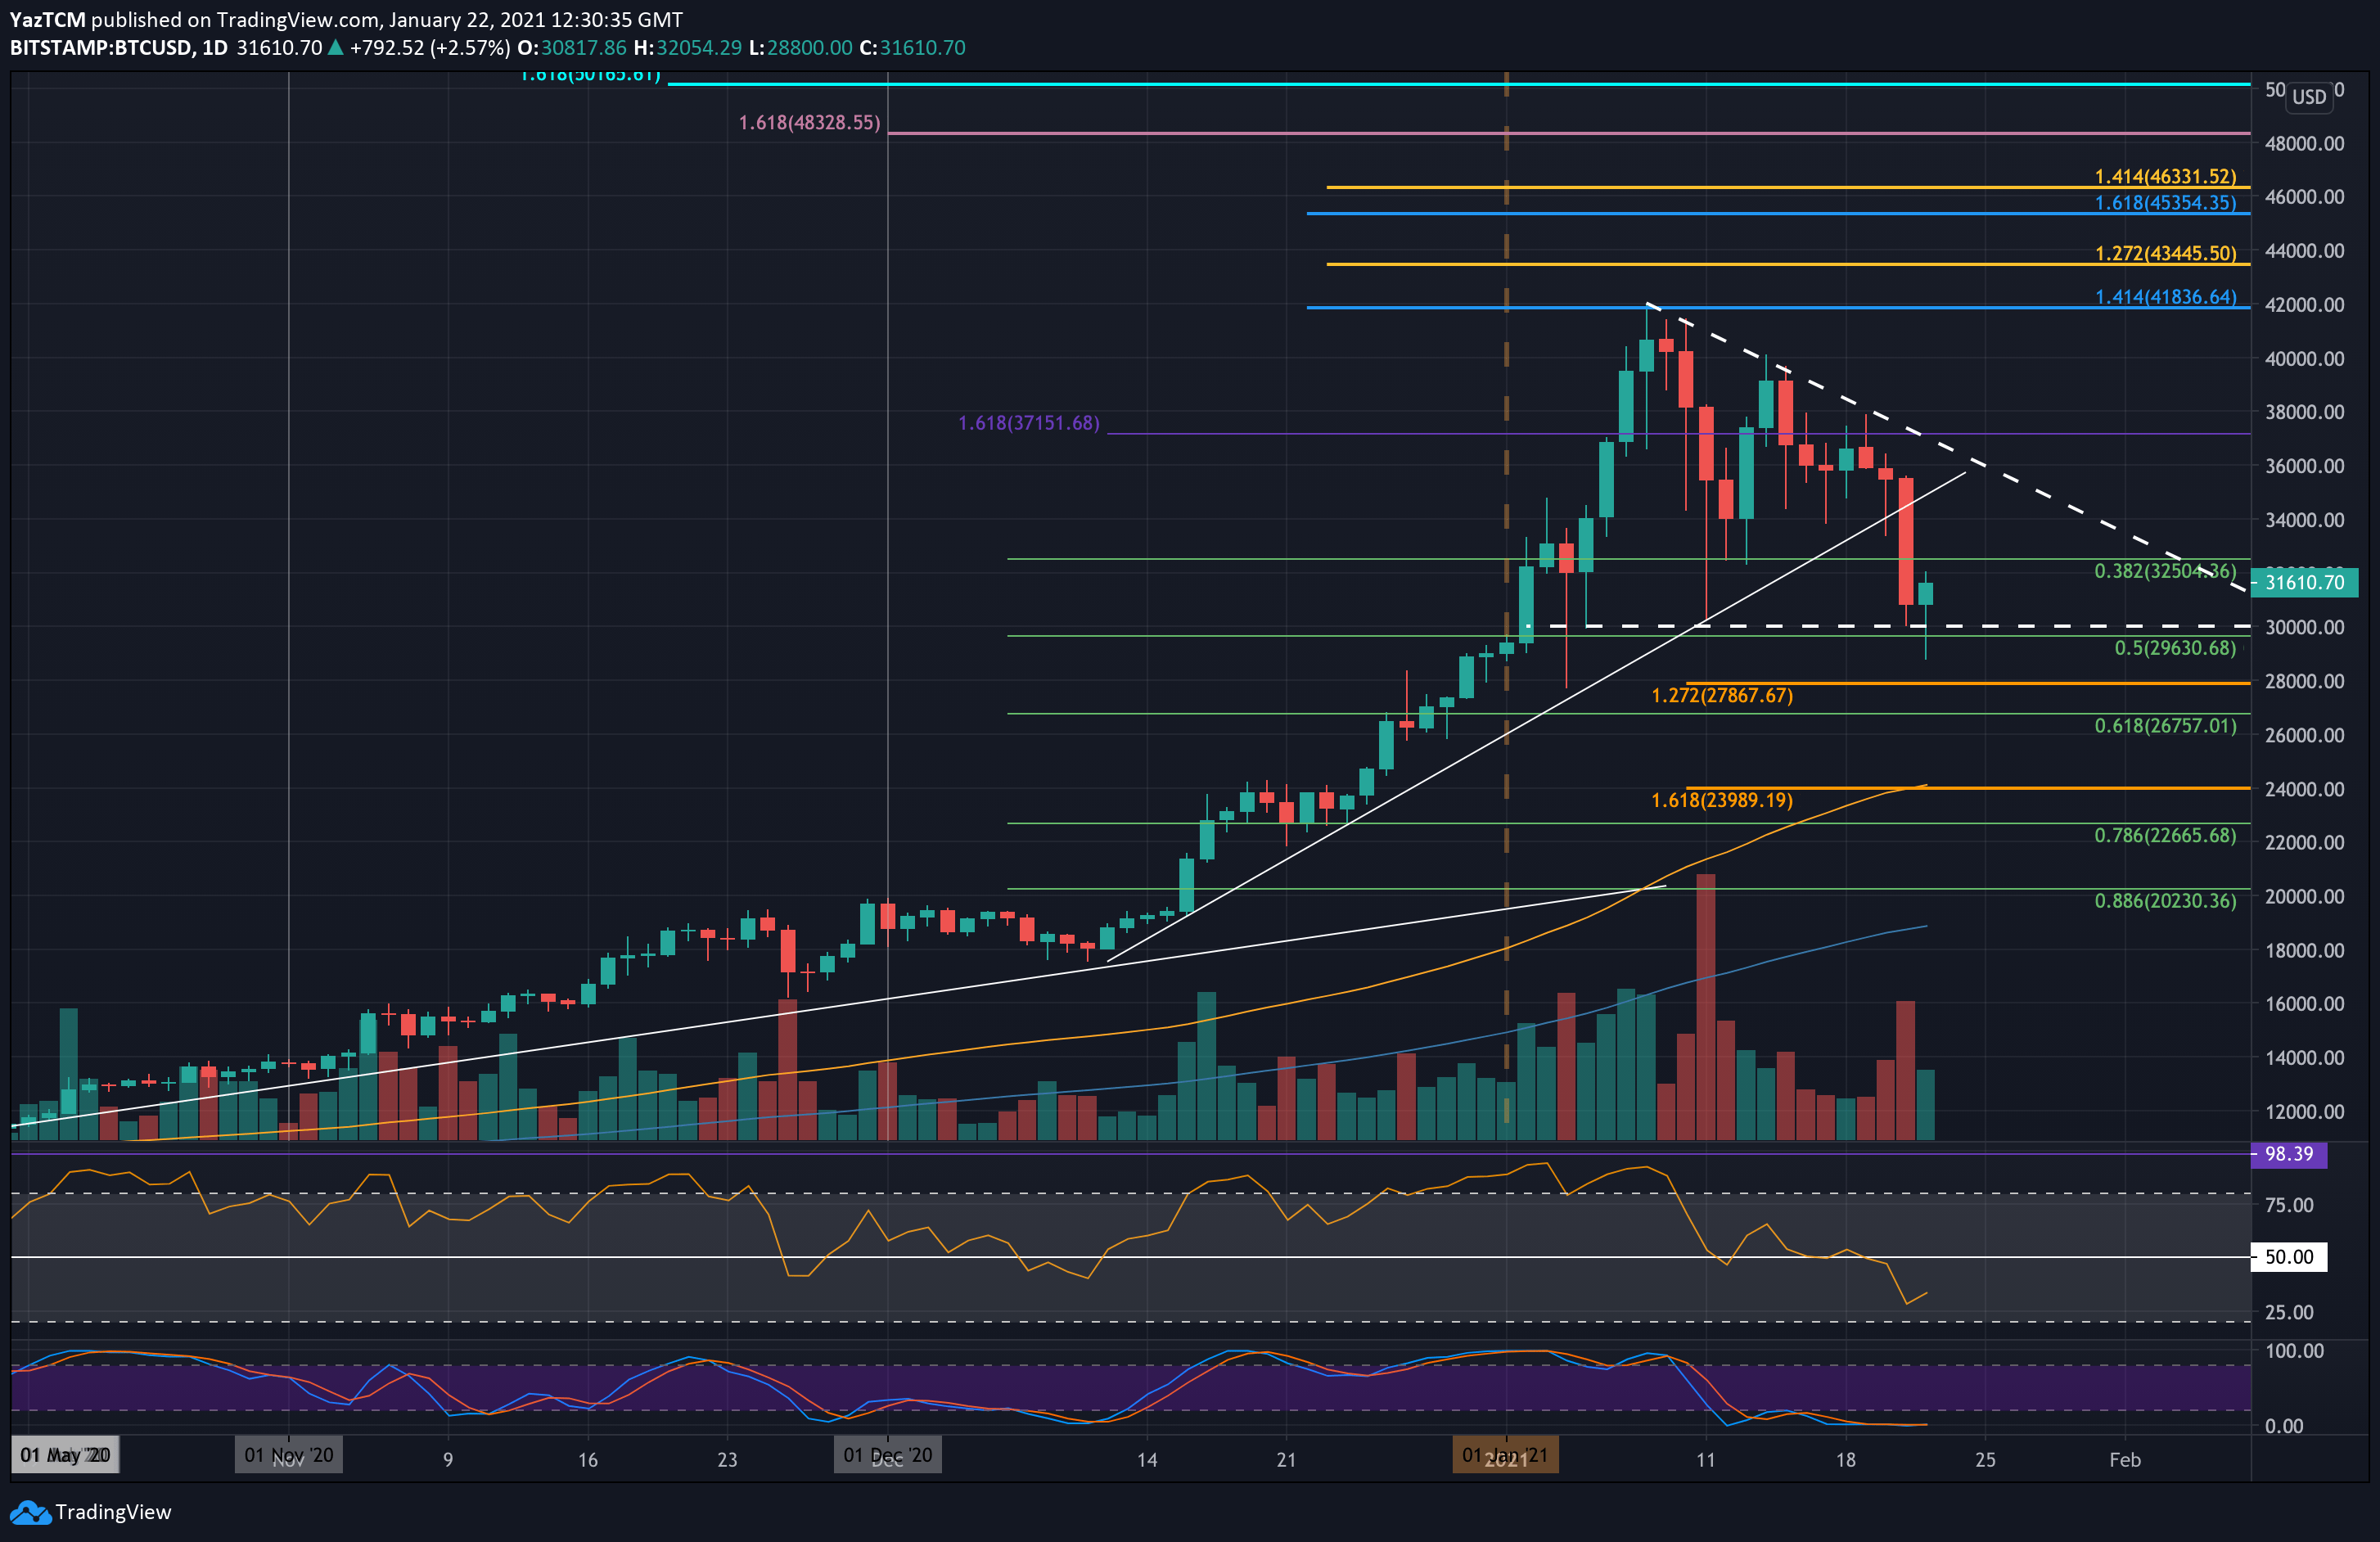
BTC/USD Daily Chart: Source: TradingView
Bitcoin suffered a severe 15% decline in the past 24 hours, which saw the cryptocurrency dropping by $7,000 to reach below $29K. In doing so, it fell beneath the previous symmetrical triangle we were tracking and landed at the lower border of a long-termed bearish triangle.
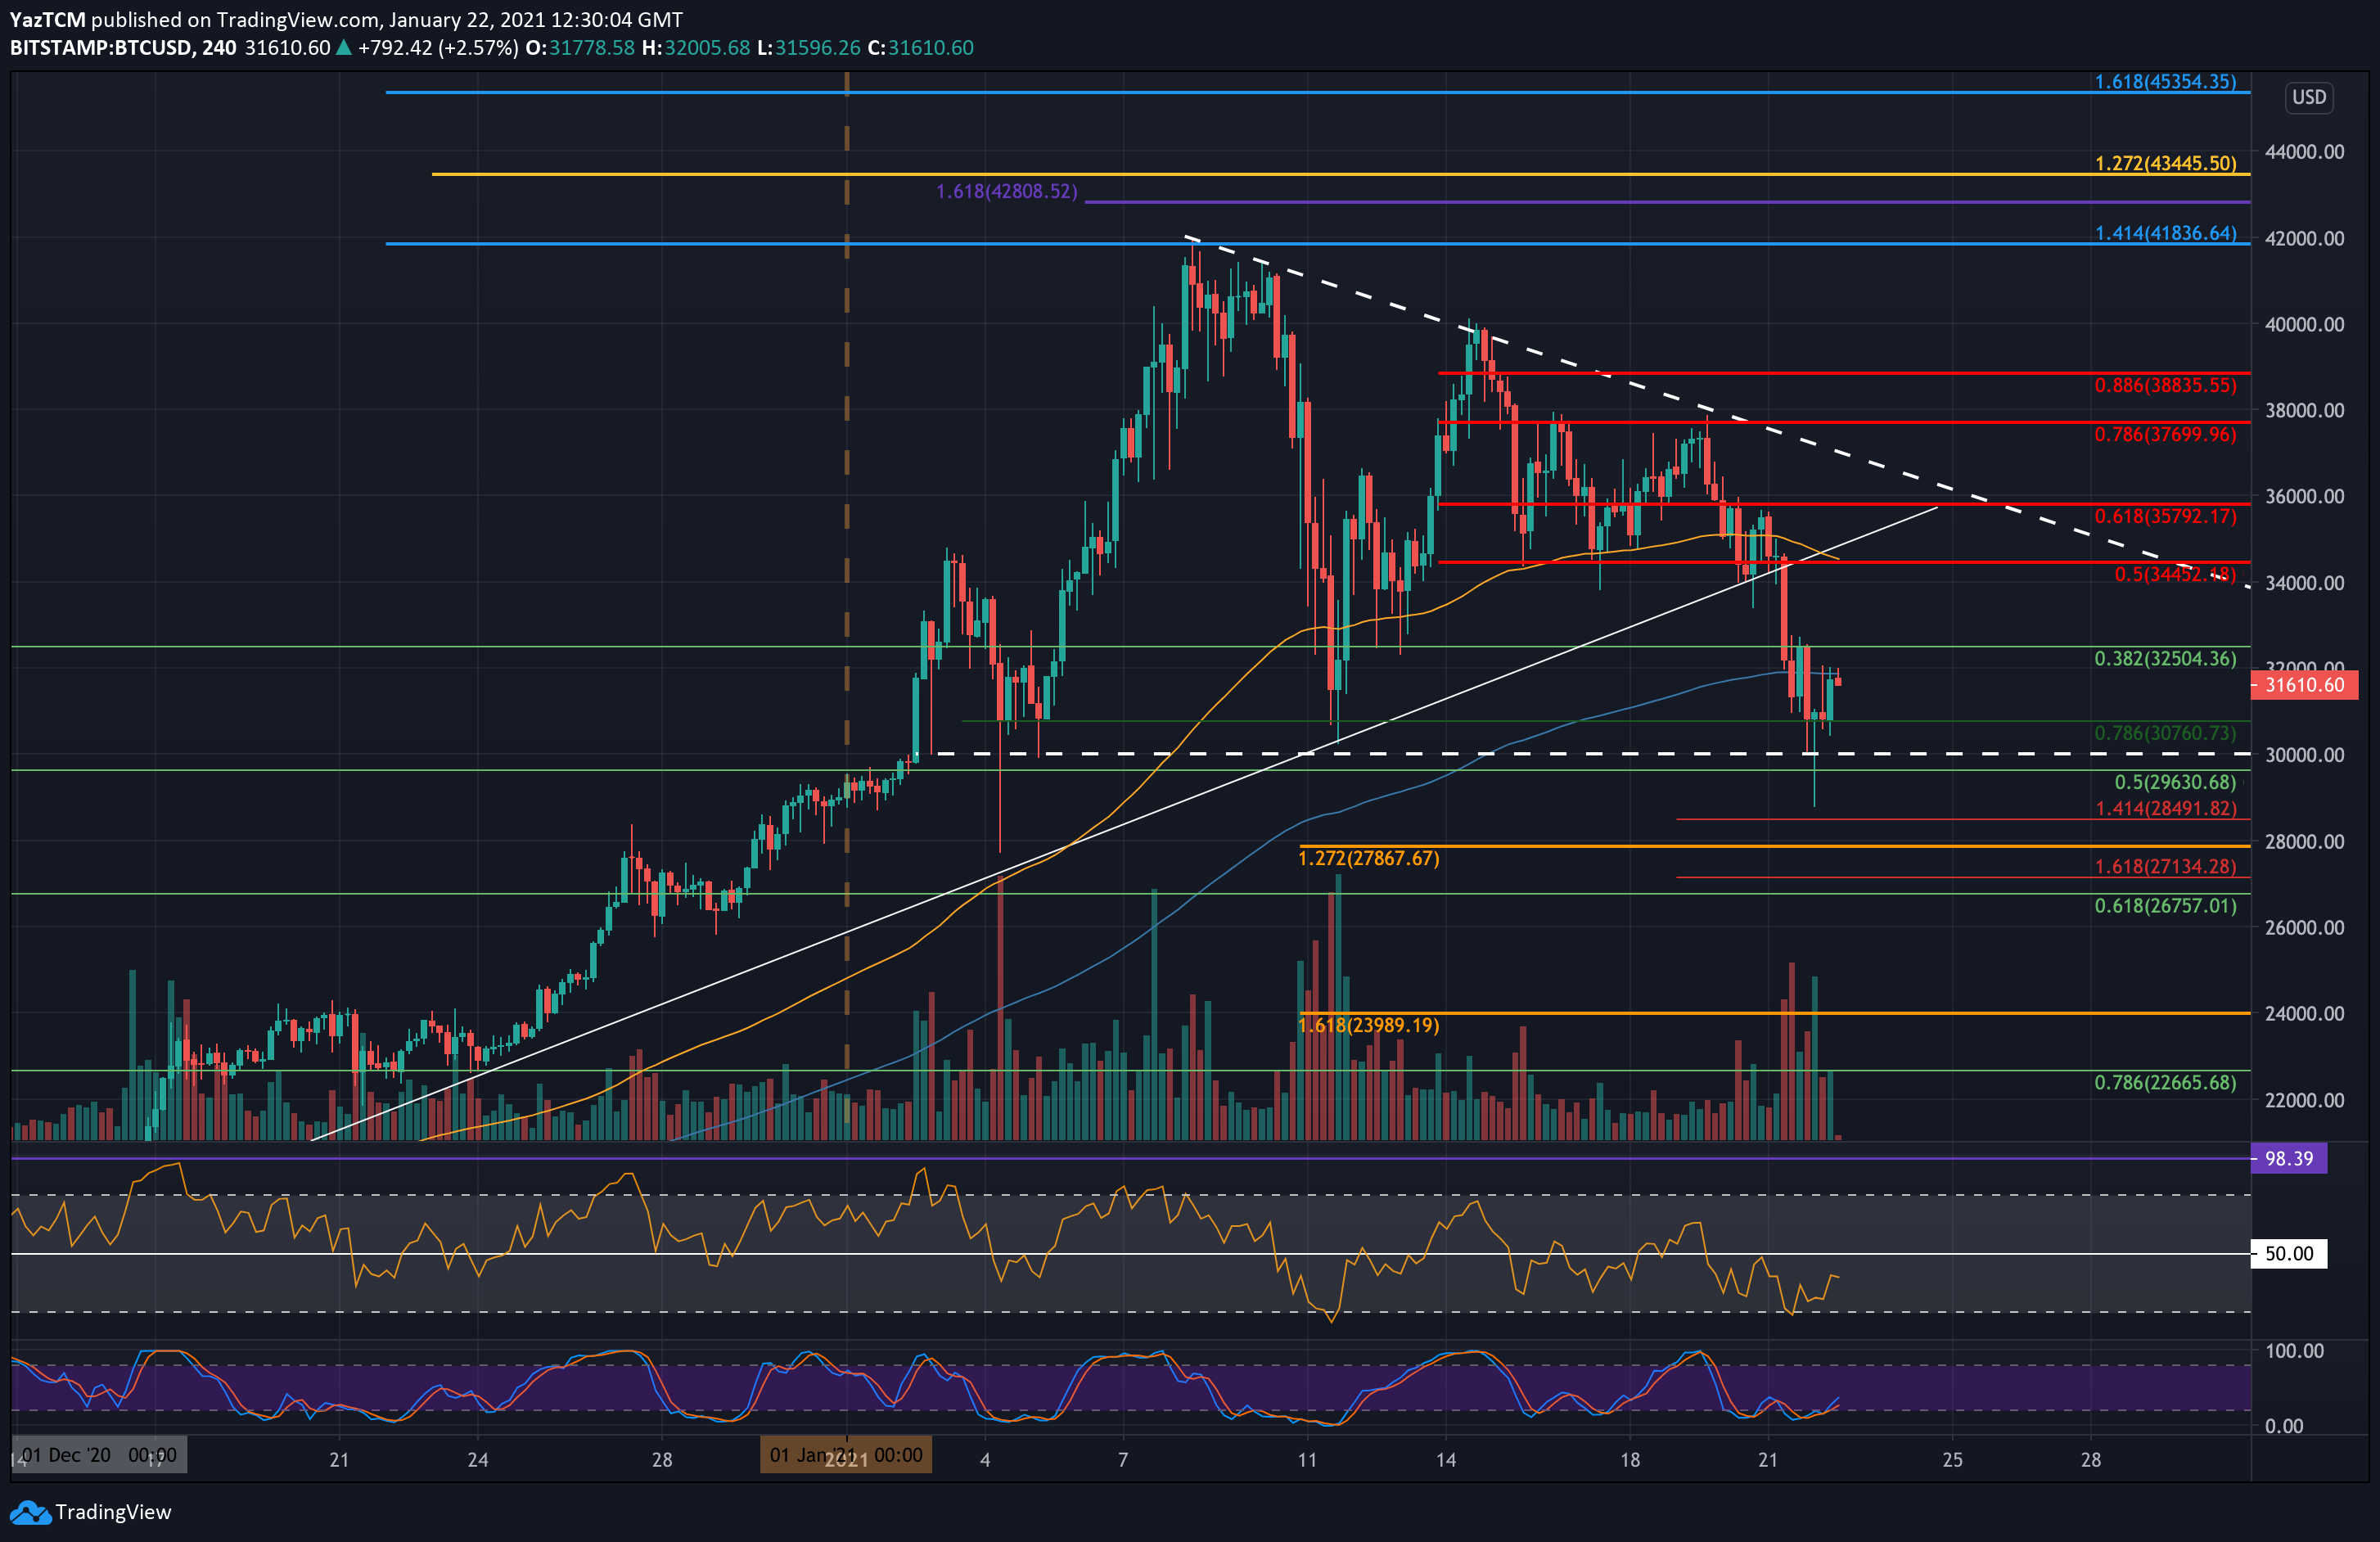
More specifically, Bitcoin managed to find support at the $30,760 support we highlighted yesterday, provided by a short term .786 Fib Retracement level. However, BTC did spike beneath this, reaching as low as $28,800 today, but it did not close a 4-hour candle below the support, which might turn short term bullish for a possible correction (which already started).
A strong surge in volume accompanied the rebound at the support located at the bottom of the triangle. It had increased each time Bitcoin approached this level on the last three occasions, which led to a reversal.
Nevertheless, all eyes are now focused on the $30,000 support level. A breakdown of this could see Bitcoin heading back beneath the 2021 opening price toward $26,000.
Key Support Levels: $30,760, $30,000, $29,630, $28,500, $27,870.
Key Resistance Levels: $32,500, $34,000, $34,450, $35,800, $36,200.
Looking ahead, if the sellers head to the downside, the first level of support lies at $30,760 (short term .786 Fib). This is followed by the lower boundary of the descending triangle at $30,000.
The next targets at $29,630 (.5 Fib), $28,500 (short term downside 1.414 Fib Extension), $27,870 (downside 1.272 Fib Exetension), and $26,760 (.618 Fib).
On the other side, the first level of resistance lies at $32,500. This is followed by $34,000, $34,450 (bearish .5 Fib), $35,800 (bearish .618 Fib), and the upper border of the triangle, around $36,200.
Looking at the 1-hour rsi, we can identify a bullish divergence. Along with the huge volume of the 4-hour buyers candle, it might turn bullish in the short term.