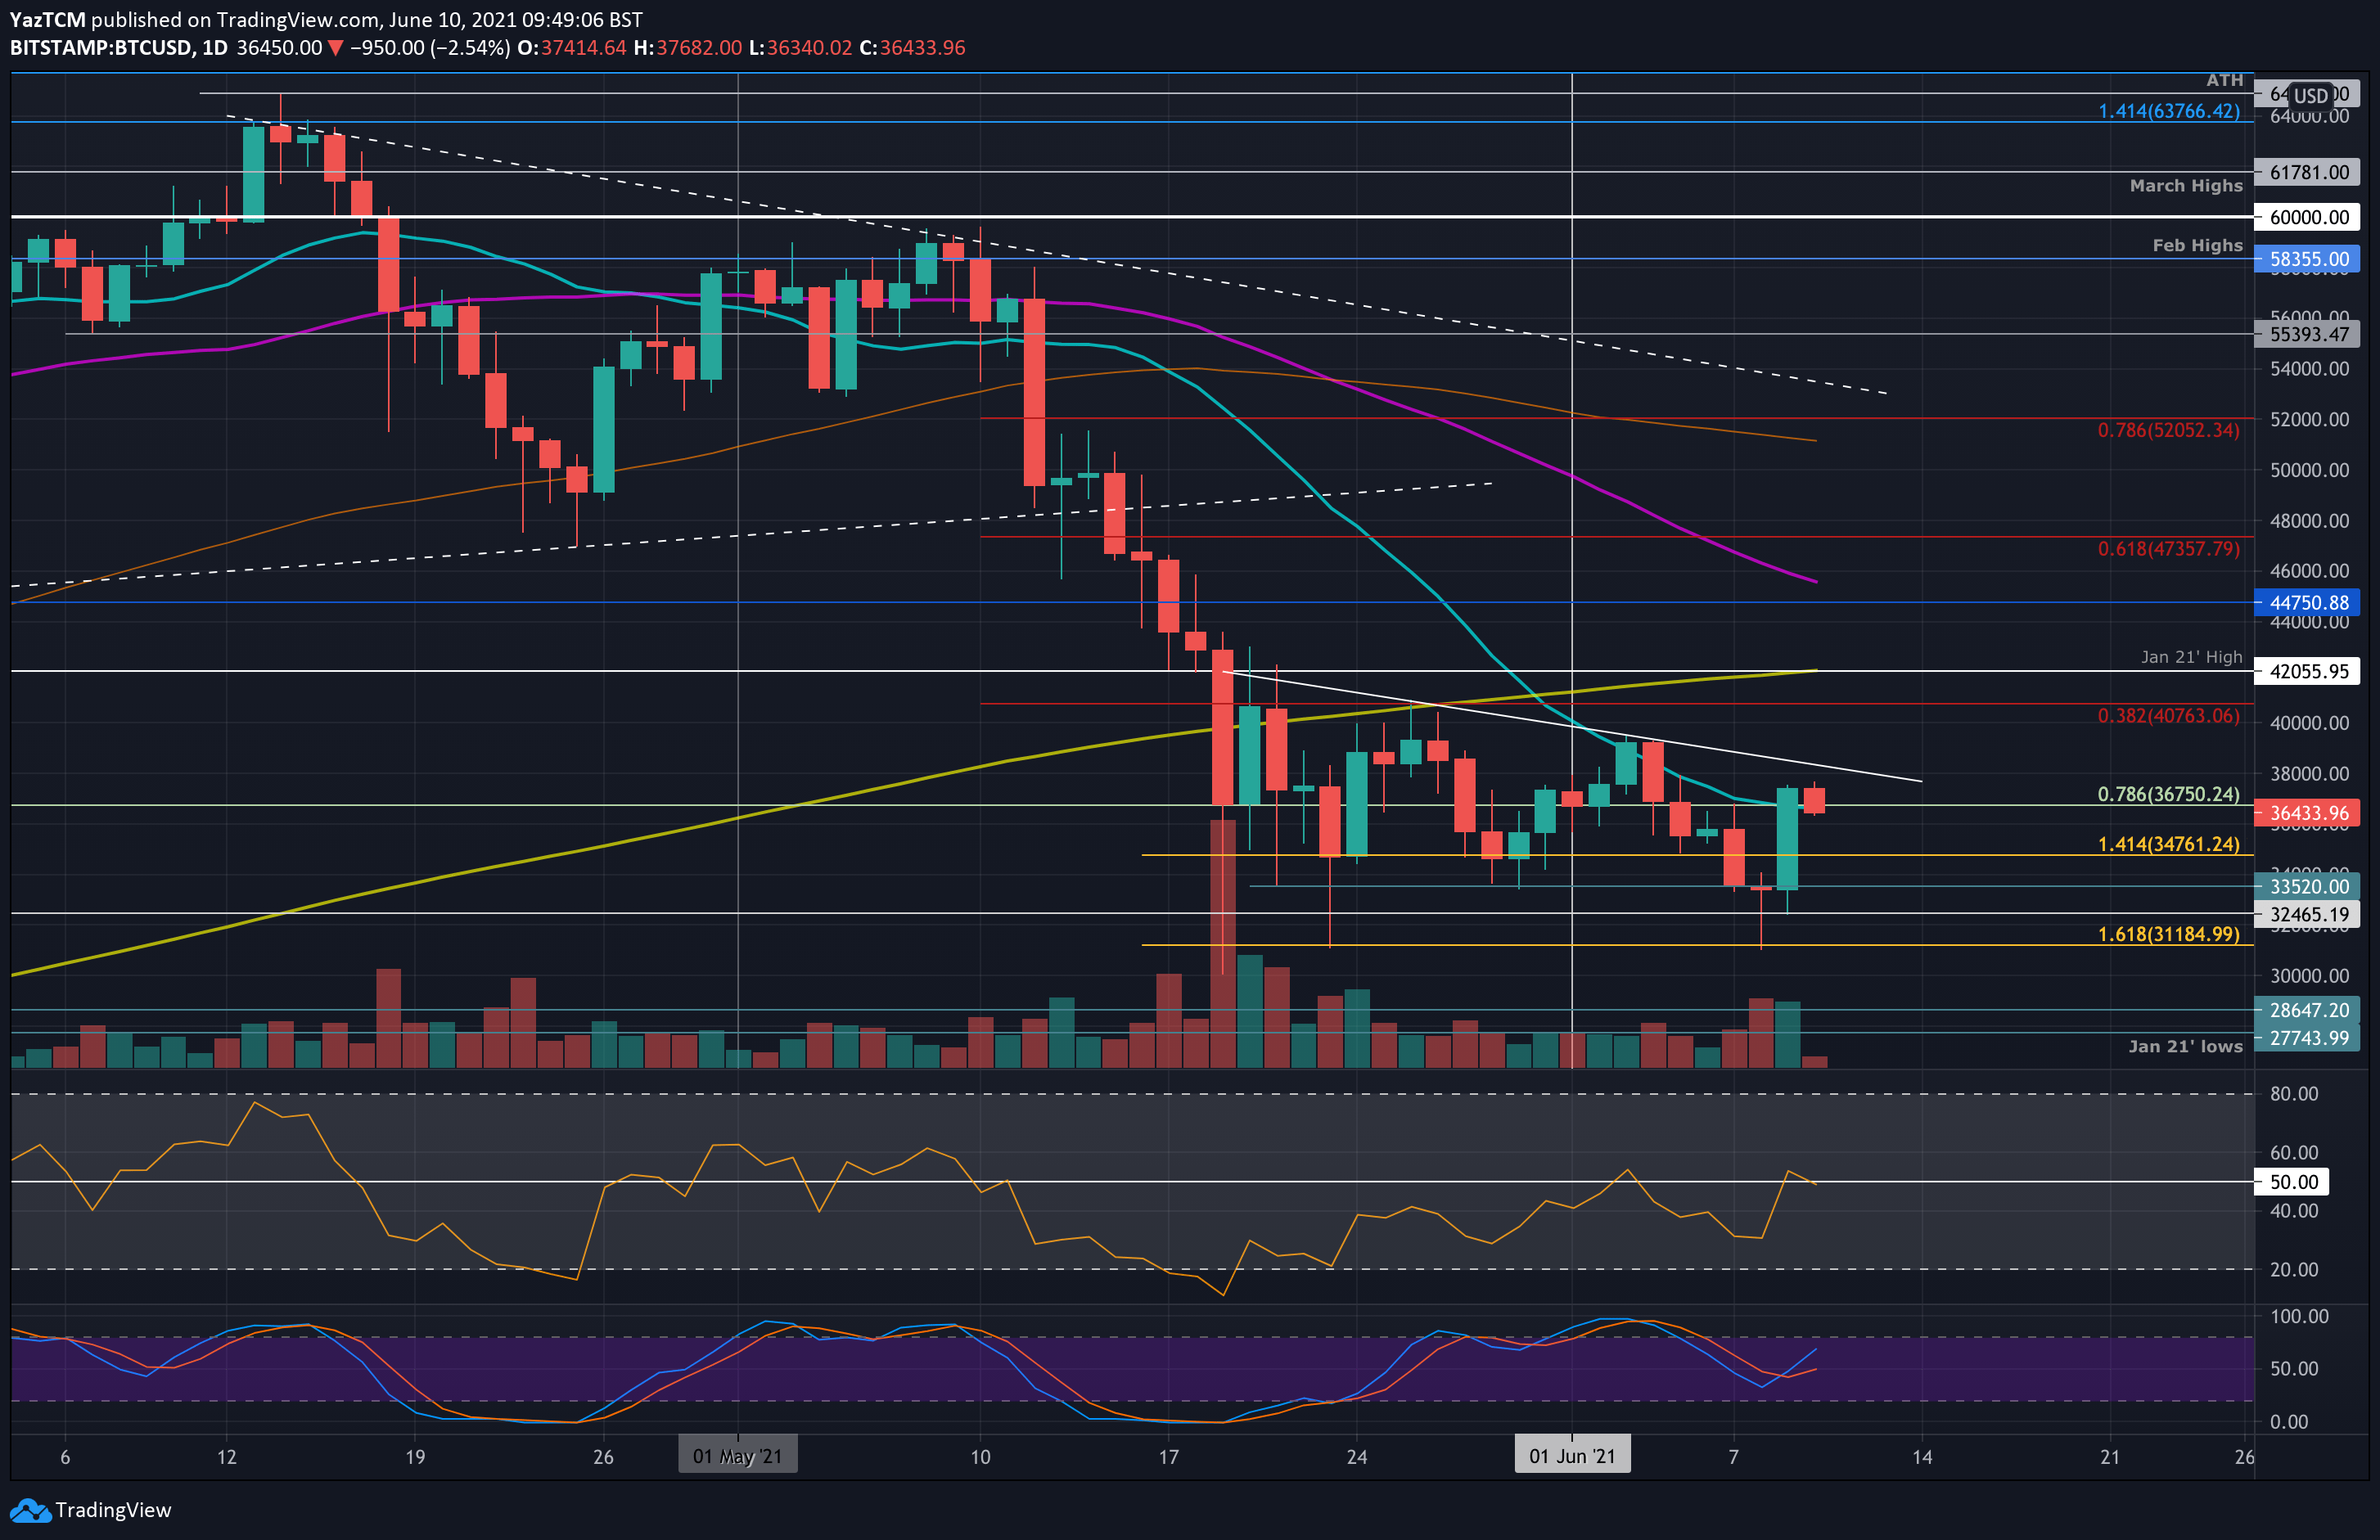
BTC/USD Daily Chart. Source: TradingView.
Bitcoin remains up by a strong 8% over the past 24 hours of trading as it gained over $6K in less than two days, before slightly retracing from the $37.6K resistance area.
The primary cryptocurrency has seen a very interesting but volatile week after breaking beneath a symmetrical triangle pattern on Monday and sharply dropping as low as $31,000 on Tuesday. However, the rebound was even quicker, and as mentioned above, earlier today bitcoin reached resistance around $37,630, provided by a short-term bearish .786 Fib Retracement level. Roller coaster.
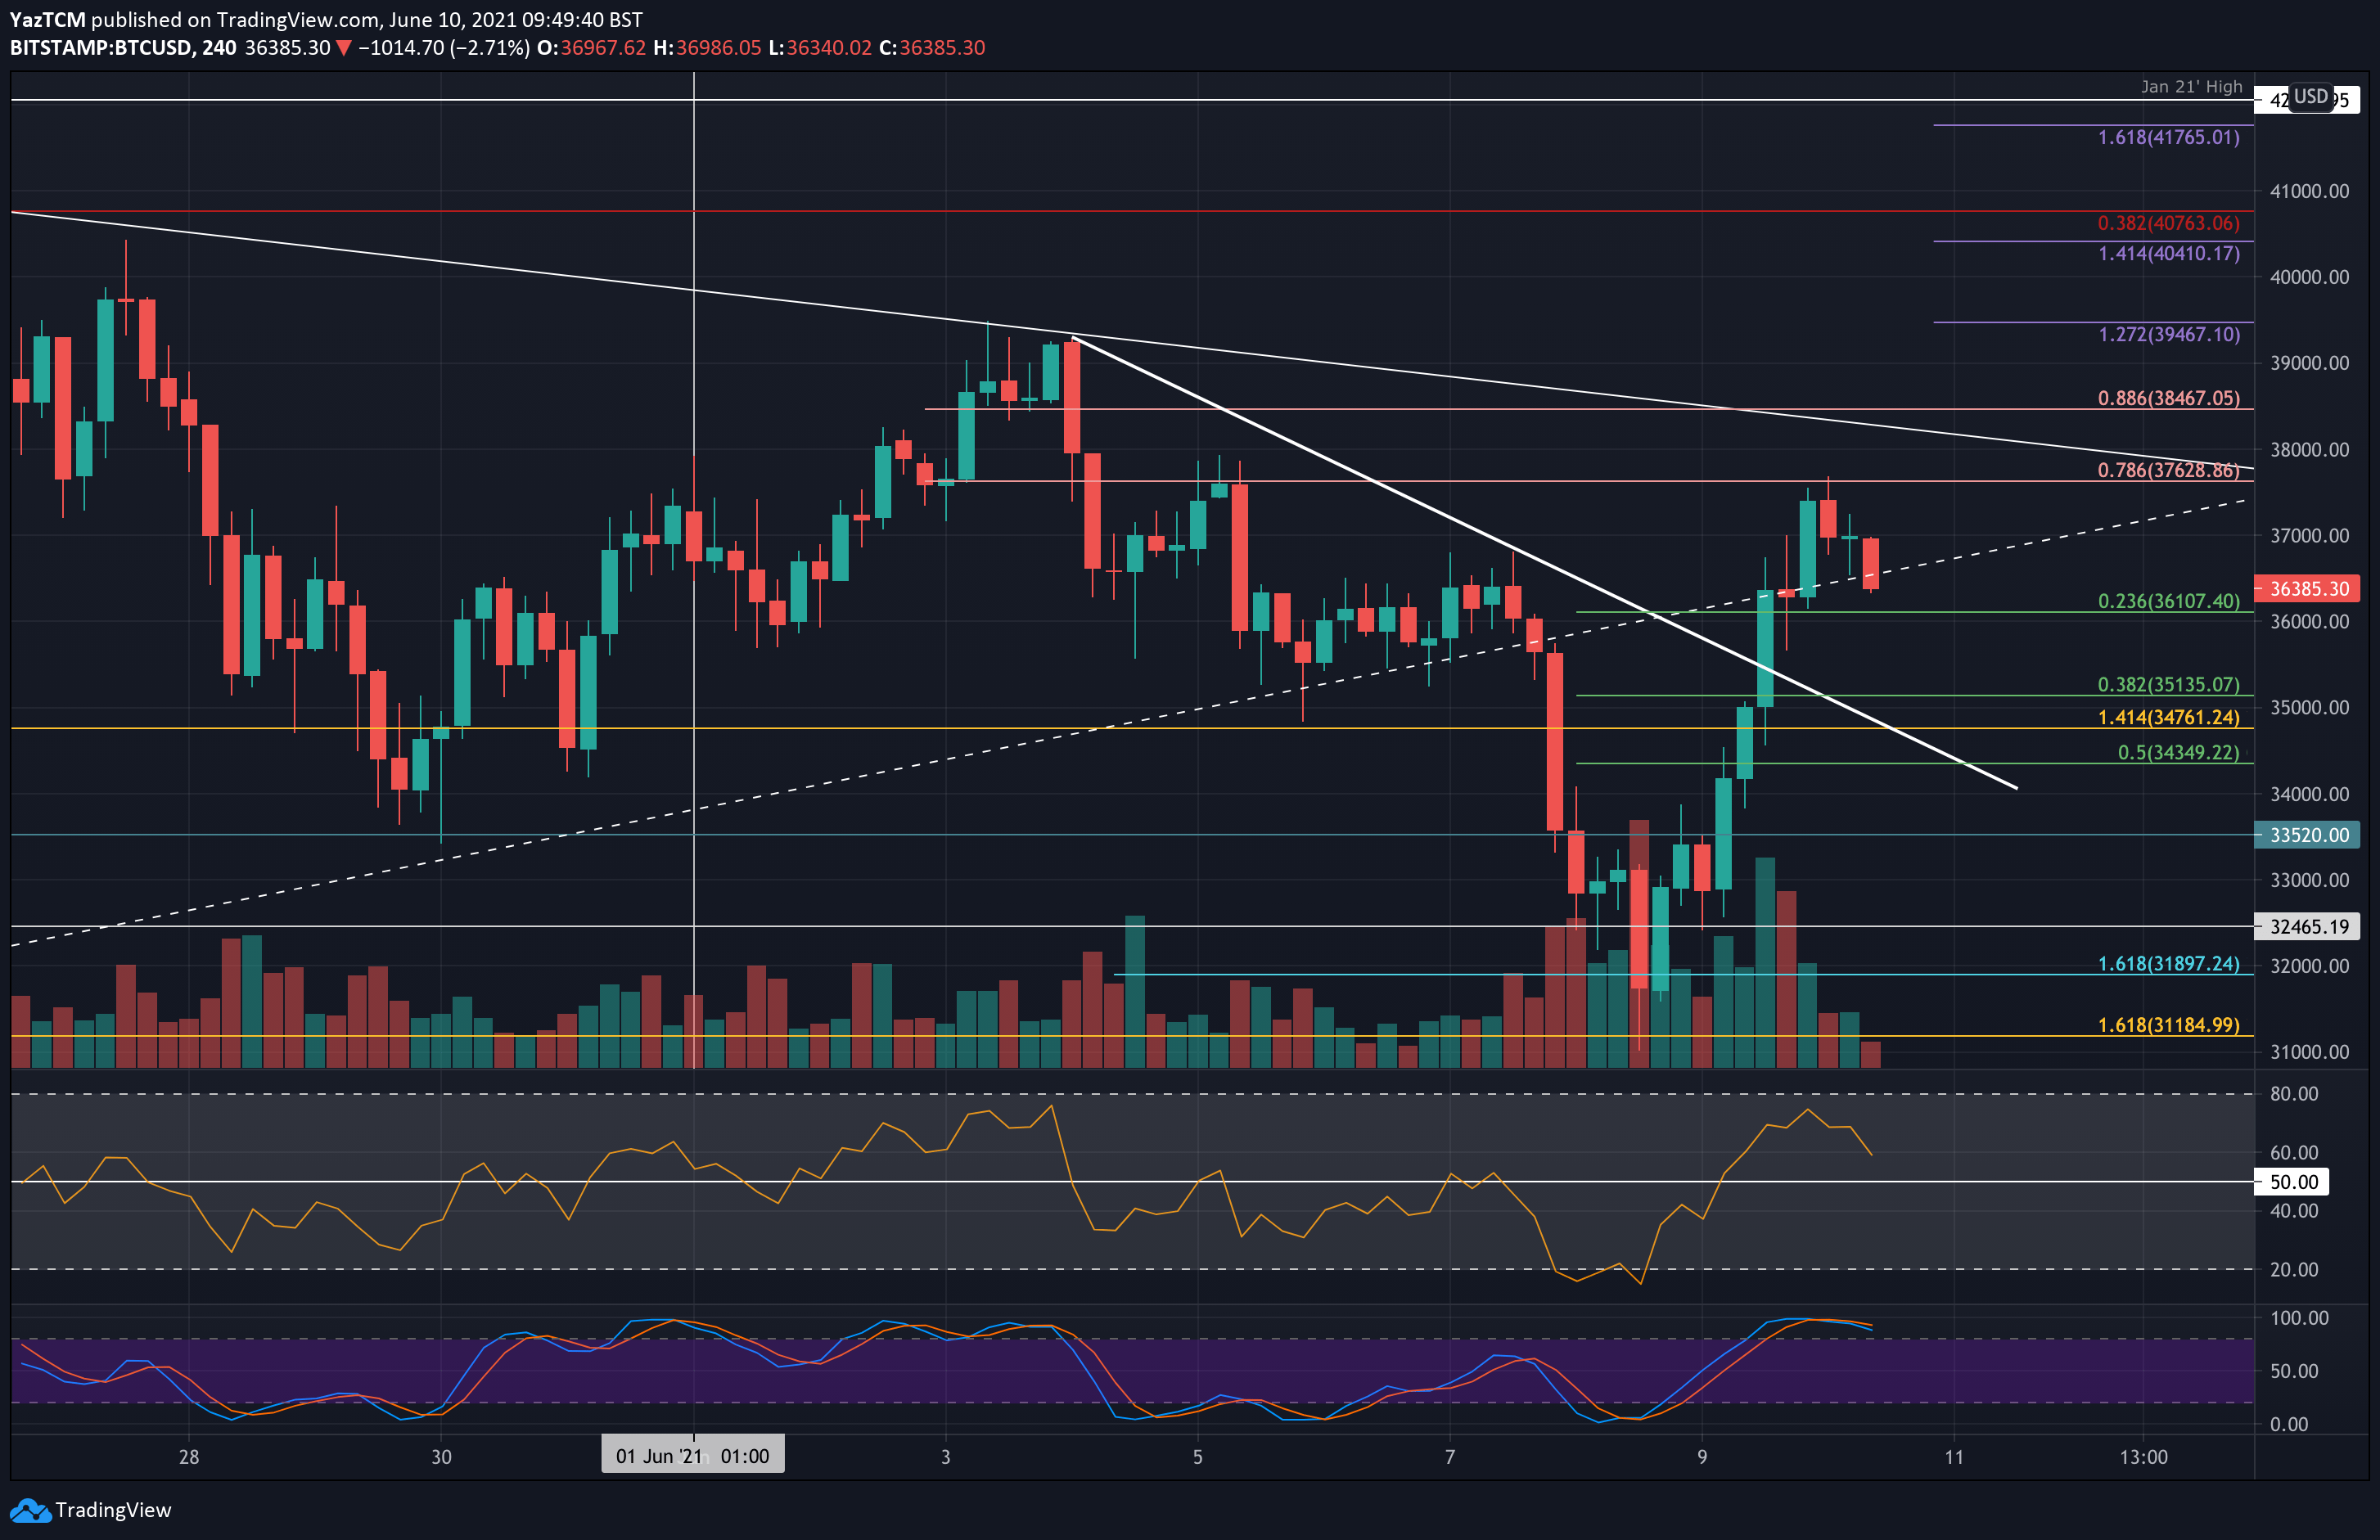
As of writing these lines, bitcoin is retesting the lower boundary of the triangle amid the $36k level, which became support.
As mentioned in yesterday’s analysis, the last three days of candles have formed a perfect morning start reversal pattern. This could be the first indication that bitcoin is attempting to rebound and set a temporary bottom following the severe decrease since mid-May, which resulted in a 50% loss.
Another bullish sign is coming from the decent wicks that can be seen on the daily chart. As for the four days bitcoin dropped below $33k, buyers rushed to buy and increase the price and closed the daily candle above that level which indicates strong accumulation.
Another thing to note is the “floor” forming around the $30k-$31k mark, which is so far seen as a triple bottom (bullish pattern) over the past month. This is true unless the latter breaks down.
However, it is essential to note that vitcoin is still forming a series of lower highs trajectory on the daily chart and must break the high from early June at $39,400 to indicate that this 2-month long (since current mid-April ATH) downward trend is starting to fade. Additionally, it would still need to break the strong resistance at $42,000 (200-day MA and previous January high).
Key Support Levels: $36,100, $35,130, $34,350 – $34,000, $33,520, $33,000.
Key Resistance Levels: $37,630, $38K, $38,470, $39,400.
Looking ahead, the first support lies at $36,100 (.236 Fib). This is followed by $35,130 (.382 Fib), $34,350 (.5 Fib), $34,000, and $33,520. Added support is found at $33,000 and $32,465.
On the other side, the first resistance lie at $37,630, which is yesterday’s and today’s high as of writing these lines, along with the bearish .786 Fib level. Further above lies $38,000 (the descending trend line), followed by $38,470 (bearish .886 Fib), $39,400, and $40,765 (medium-term bearish .382 Fib).
The RSI has returned to the midline, indicating indecision within the market. On the recent rebound, it did spike above 50 but was unable to surpass the early-June peak. This indicates that the bullish momentum might have quickly faded, and the downtrend still remains intact until the RSI can produce a clear push above the 60 level.